8 August 2023
Summary
In equity management, at its core, Beutel Goodman is a bottom-up investor, focused on individual businesses rather than macroeconomic conditions. In this paper, the Beutel Goodman U.S. & International Equities team discuss their views on some limitations of using macroeconomic conditions to make investment decisions and how our disciplined equity investment process is designed to focus on the areas where we have the best visibility and control.
By Beutel Goodman’s U.S. & International Equities team
There are many factors that influence equity investment returns. As an investment manager, we have a fiduciary duty to responsibly manage the funds that are entrusted to us by our clients. For us, this responsibility means that our process is designed to make the greatest impact towards our goal of creating portfolios with both compelling upside potential and limited downside risk. This paper explains why our investment approach focuses on individual businesses (“bottom-up”) rather than general macroeconomic conditions (“top-down”).
Macro Forecasts are an Unreliable Tool for Equity Investment Decisions
The world has experienced its fair share of crises since the turn of the new millennium; hindsight may lead one to lament the warning signs that were missed. In the late 1990s, all the signs pointed to an asset bubble in technology and biotechnology, as low interest rates stoked risk taking in tech stocks. The next decade brought the Global Financial Crisis (GFC) of 2008–09, when financial deregulation, tax cuts, government deficits and consumer debt levels were all evident. While a small minority of strategists may have predicted these events and their impact on markets, the vast majority did not. For investment managers, it is extremely difficult to consistently make portfolio decisions solely based on the timing and the extent of macroeconomic downturns or geopolitical crises.
While there may be valid long-term indicators and demographic projections, as well as trends such as the shift in global economic activity towards emerging markets, these factors are gradual and generally well-understood by capital market participants. Meanwhile, the economic calendar is cluttered with short-term indicators that may not be relevant for long-term investors such as Beutel Goodman.
Some macro strategists can also suffer from a negativity bias (they are known as “perma-bears”). As John Stuart Mill wrote, “the man who despairs when others hope, is admired by a large class of persons as a sage.” Pessimism, presented as caution, may appear to be a sound approach for a prudent investor to take, but this is not likely to be a profitable strategy in the long run.
The Folly of Turning Macro Analysis into a Stock Call
Even if macro forecasts were reliable and an investor was able to make an accurate top-down call, converting that information into a beneficial stock call is nearly impossible — the math simply works against you. Consider a (highly unlikely) scenario where an investor analyzes weekly inflation data going back to 1876, spends decades crunching the numbers, discusses the topic with an AI robot, then runs a psychological assessment of every U.S. Federal Reserve (Fed) voting member with the goal of knowing exactly where interest rates will be to the 10th decimal point by the second quarter of 2029. This information would no doubt be useful, but to turn it into a stock call, the investor would also need to decipher what it means for the economy, and what the economic impact could mean for the stock market (which may be running on a completely different cycle than the economy, as was the case with the short-lived downturn in 2020 related to COVID-19 lockdowns). In turn, an investor would need to consider what the mix of market and economic forces means for specific sectors, as well as how particular stocks might react within a given sector. In other words, it’s a real dog’s breakfast with a multitude of potential outcomes.
This means that trying to make a stock call based on a prediction of a specific macro factor is highly unlikely to work over the long term. In studying statistics, a student is quickly introduced to the concept of the decision tree; a key takeaway is that the greater the number of branches on a decision tree, the greater the probability of being wrong. There are too many economic variables to call, and too many inter-linkages within those calls to have a high-probability decision tree.
When analyzing general equity or risk allocations, for example, historical data shows no consistent stock market performance trends related to GDP growth forecasts. Looking at over 40 years of data in Exhibit 1 below, we note a rather weak correlation (R2 of 0.21) between MSCI World annual returns and the following year’s global developed markets’ GDP growth. Put another way, assuming a prediction of next year’s economic growth was correct, an R2 of 0.21 means implementing a trade as a result of your prediction would effectively be a random guess. Investing based on knowledge of a macro factor like GDP therefore wouldn’t likely help improve investment outcomes.
Exhibit 1: Stock Market Returns & GDP. This graph shows regression analysis of MSCI World Index returns versus 1-year forward Developed Economies Real GDP Growth (1980–2022). A comparison of MSCI performance and Developed Economies GDP Growth over the past 40+ years shows little correlation. 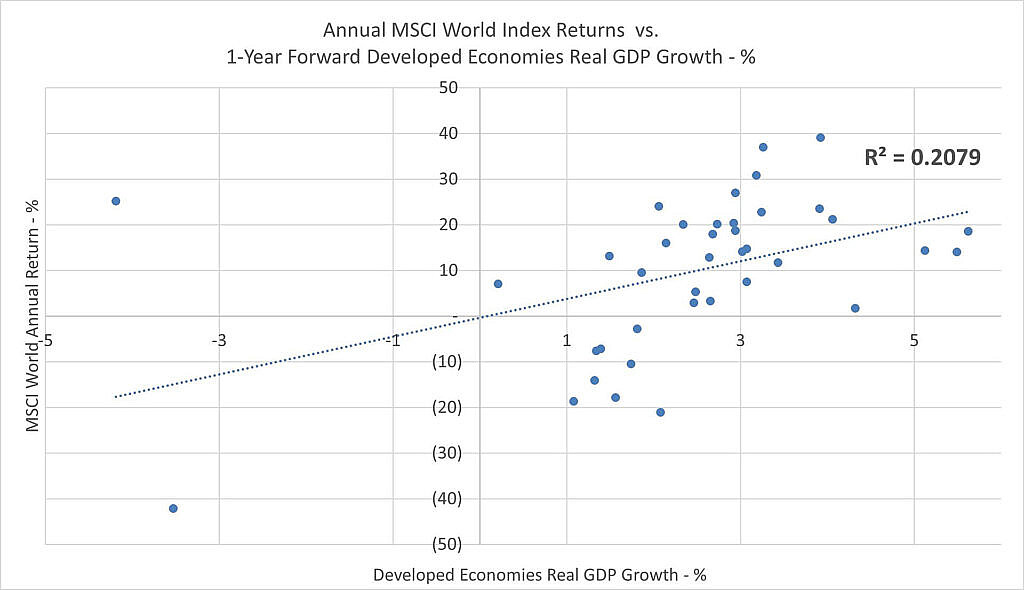
Source: Bloomberg Finance L.P., Beutel Goodman
Sweeping Predictions Miss Underlying Company Variety
Some investors convert macro inputs into style or sector bets. In our view, the classifications of cyclical versus defensive companies, or risk-on versus risk-off trades, are dubious. For example, consider the dispersion of individual stock returns in the S&P 500 and S&P Global 100 indices in 2022, classified within quartiles in Exhibit 2 below. The S&P 500 bottom-quartile performance by companies (equal-weighted) averaged -42% while top-quartile company performance averaged +27%. Considerable differences can be replicated using other time horizons or indices (e.g., the S&P Global 100 shows an average return of +30% and -30% for the top and bottom quartile, respectively). Further, the bottom quartile for both indices includes companies from nine of the eleven GICS sectors, and the top quartile includes companies from all eleven (nine for the S&P Global 100). It is our view that the dispersion of individual company returns contradicts bigger-picture bets such as risk-on versus risk-off or favouring a particular sector.
Exhibit 2: Dispersion of Returns. The chart below shows returns dispersion for the S&P 500 and S&P 100 Global index constituents in 2022. These charts rank the 2022 return of the constituents of two indices: S&P 500 and S&P 100 Global, and bucket them into quartiles excluding the tails (i.e., outliers defined as 0–5th percentile and 95–100th percentile). Each colour represents a quartile and the black line represents the median 2022 return (-12.7% for the S&P 500 and -1.84% for the S&P Global 100).
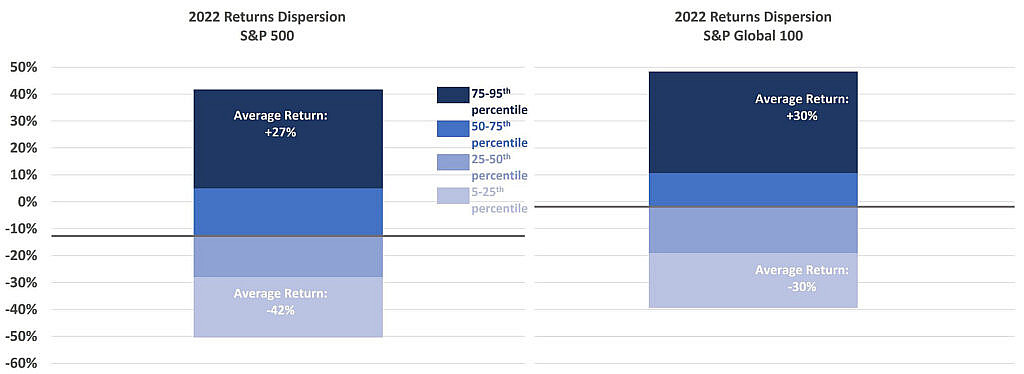
Source: S&P Capital IQ
This wide dispersion of individual company returns among sectors shows that stock selection offers an attractive opportunity for investment gains, while still maintaining risk-reducing industry diversification and providing downside protection. It also shows that expectations about indices or sectors in response to macroeconomic effects are easily distorted. Take the example of interest rate increases in 2022. Even if top-down analyses correctly predicted these hikes, the research likely pointed to the fundamentals of cash-rich Information Technology companies, as well as concern for highly levered Utilities companies. However, stocks in the Information Technology sector fared worse owing to their valuations’ sensitivities to interest rates outweighing the underlying business sensitivities to interest income gains. Utilities stocks, meanwhile, generally performed solidly thanks to their perceived stability in times of turmoil, combined with growth prospects around renewables investments.
Understanding Company Details Can Deliver Performance
At Beutel Goodman, we focus on bottom-up stock selection. Investments that demand statistically rare future growth to justify their valuations will not meet our investment hurdles. We are open to ideas across sectors, regardless of assumed macro sensitivities or sweeping predictions, following our bottom-up approach, which is designed to build portfolios of high-quality companies trading at a discount to intrinsic value.
We focus on a company’s quality, scrutinizing factors such as balance sheet flexibility, consistency of capital returns, free cash flow generation, competitive moats and incentive structures that align the strategic decisions of management and the board with the interests of long-term shareholders. These factors are essential to the trust we place in the companies in our portfolios to navigate through macroeconomic difficulties and other challenges such as technological or demographic changes. While macroeconomic factors, industry themes, and geopolitical context are embedded into companies’ operations, profitability and business value, we seek to construct portfolios where a stock thesis does not rely on uncontrollable factors like commodity price upswings or uninterrupted global growth.
No company operates in a vacuum, but it is our focus on quality, coupled with a valuation discipline, that bolsters our confidence that the companies in our portfolios should be able to weather most downturns. Macro, industry and thematic considerations help us to evaluate company development, but each investment is viewed through the lens of an individual company. On occasion, market reactions to macro or thematic concerns present us with opportune entry points to purchase companies that meet our standards at a discount to their business value. We will explore two examples in this paper to illustrate our approach to fundamental, bottom-up global equity investing.
We note that while the ultimate sector and regional composition of our portfolios reflect bottom-up considerations, care is taken to avoid excessive concentration in any particular area of the market. Our portfolios seek to balance an unconstrained approach to idea generation with diversification requirements, including policy restrictions around overexposure to any one sector. Our portfolios are constructed based on our fundamental, independent assessment of companies’ quality and value characteristics, without consideration for the index, and generally show independence and active tilts in both regional and sector allocations.
Exhibit 3: Portfolio Allocations & Fund Construction. The graphs below show the difference between Beutel Goodman World Focus Equity Fund, the MSCI World index, and median peers in the eVestment Global Large Cap and Global Large Cap Value eVestment universes.
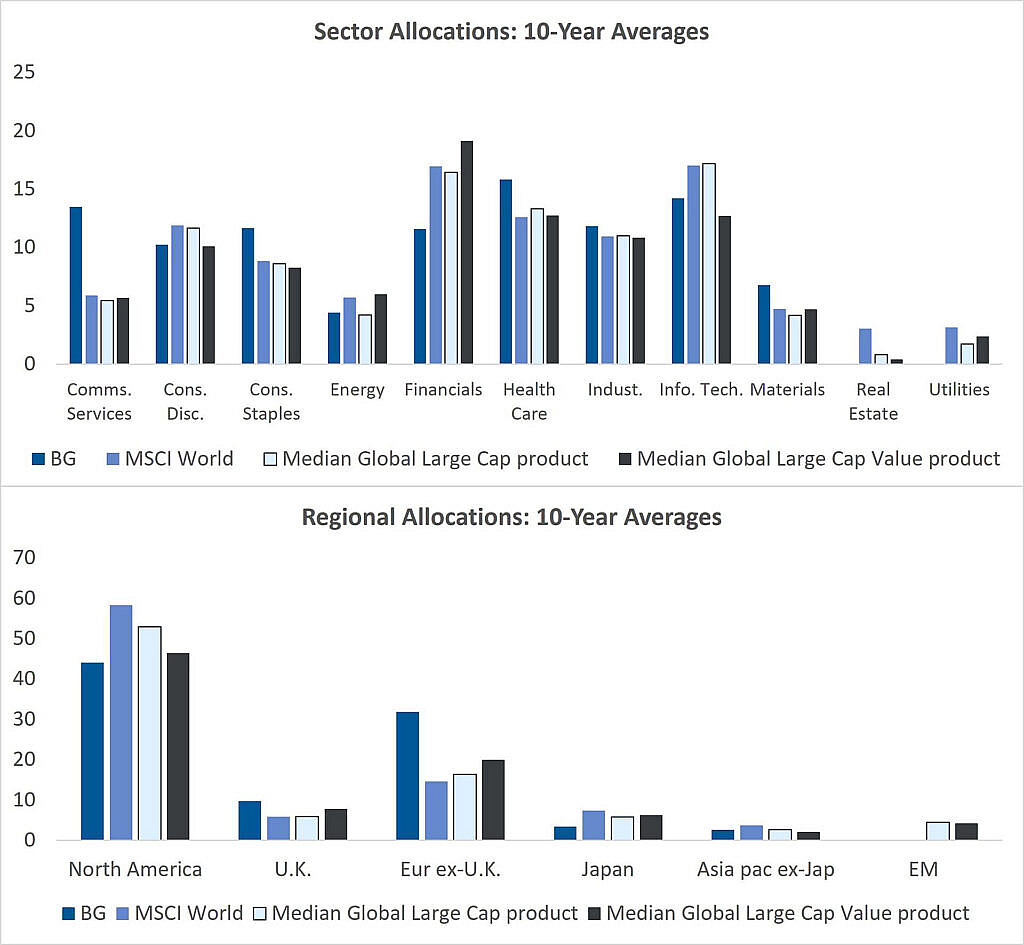
Source: Beutel Goodman, eVestment
AutoZone Inc. and SMC Corp, two past holdings in our portfolios, provide examples of how top-down forecasts can be unreliable, how sweeping predictions may exclude companies, and how a deep understanding of a company’s operations can help deliver results.
AutoZone Inc.
AutoZone has been an exception to typical macroeconomic and thematic classifications. It is categorized as Consumer Discretionary, yet it provides maintenance of older vehicles, which is not generally a discretionary expense for most customers. It is also in some measures an “e-commerce laggard”, although this can be attributed to its clients’ preferences, rather than the technological disruption brought on by Amazon’s growth. Applying macroeconomic and industry trend predictions to the analysis of AutoZone as an investment case would result in it being mis-calibrated, in our view. Our fundamental research on the business helped us to identify an attractive investment opportunity.
We purchased AutoZone, the leading U.S. aftermarket auto-parts retailer, in the second quarter of 2017. At the time, the company derived 84% of its sales from products dedicated to the maintenance of vehicles, and 16% from discretionary auto accessories. From a sales channel standpoint, over 80% of products were sold via retail (“do it yourself” or “DIY”) channels, with the remainder sold via commercial garages (otherwise known as the “do it for me” or the “DIFM” market).
Beyond its wide selection of parts, AutoZone presented several attributes that we believed would protect both profitability and provide a strong competitive moat around its business:
- An extensive and accessible network of ~5,400 stores, with 80% of the U.S. population living within eight miles of an AutoZone location
- Strong inventory breadth, scale and cost efficiencies, as well as strong profitability based on its position as the largest player selling both branded and own-brand merchandise
- Highly trained staff providing technical and customer support in a market that often requires it
These high barriers to entry were reflected in AutoZone’s consistently high return on invested capital (ROIC). In turn, AutoZone’s strong free cash flow generation was being used conservatively, to open new stores, as well as to buy back shares, providing evidence of disciplined capital allocation.
At first glance, this appeared to be a classic “Beutel Goodman stock.” In Q2/2017, AutoZone shares had tumbled almost 30% from its 2016 highs due to a number of factors. We believed the shares were oversold due to concerns including weather conditions, consumer spending and vehicle fleet age. The threat from Amazon that has affected much of the retail industry and slowing same-store sales over several quarters were other considerations.
Focusing on the “Amazon threat”, at the time, several sell-side researchers and strategists had lumped auto-parts retailers in the “traditional retailers threatened by Amazon” bucket. We at Beutel Goodman were well aware of this threat, but we conduct our own in-depth assessment of company fundamentals and competitive dynamics.
In 2017, Amazon had been building out its auto-parts business; in addition to constantly increasing its automotive components inventory to tens of thousands of auto parts, it was also attempting to construct an active online community that would provide material such as videos, but also serve as a substitute for the auto retailers’ knowledgeable sales associates.
Our research showed that Amazon’s auto sales were mostly DIY, with more than half of these sales in the accessories category. Our research also supported the belief that the service level and distribution network of the auto retailers would act as a solid defense to the online threat, just as some other retailers have been able to do in defense against the online giant.
We also identified several interesting aspects of the market that we believed would benefit the auto-parts retailers. Many customers paid in cash, while approximately 50% of online orders placed were picked up in-store. This suggested a high demand among consumers for advice in how to best use these products. In fact, AutoZone’s “buy online, pick-up in-store” sales were the fastest-growing sales channel for the company. Finally, the high private home brand label penetration for auto parts was another factor that benefited the established retailers, with those private label prices only slightly above Amazon’s prices.
Overall, we assessed that the interplay of these factors should translate to a strong defense against the Amazon threat for AutoZone.
Our buy thesis was centered on AutoZone as a leading retailer in the U.S. in a segment with distinct competitive advantages accruing to the large incumbents; the business also had solid defenses against the online threat and strong and shareholder-friendly management. Meanwhile, we assessed that an overblown thematic trend had contributed to an attractive buy price for us, while a drop in same-store sales — assumed by many as a sign of things to come for the auto-parts retailers due to the threat of online disruption and muted U.S. consumer spending — was instead correlated with the 2008–2009 crisis when new car sales significantly declined, which led to a delay in repairs for autos and the associated spending that entails.
The stock surged in 2017–2019 and surpassed our upside target in March 2019, leading to a process-driven 1/3 sale. At this time, AutoZone was showing resilience in the DIY market and progress in the DIFM segment. Management was adept at capital allocation, using free cash flow to conservatively expand and to return capital to shareholders. With the thesis intact but valuation towards the higher end of historical averages, thus reducing the upside potential, we continued to hold the stock but at a lower weight. Following a swift dip in the stock price alongside the COVID-19-related market crash, both company fundamentals and the stock continued to perform well, leading to our second 1/3 process-driven trim in March 2021. At this point, the valuation was getting closer to full potential, in our view. We therefore liquidated our holding in July 2022, in accordance with our disciplined equity process of “recycling” cash from this more expensive position to fund less expensive positions and new ideas.
Exhibit 4: AutoZone. This stock chart shows the main transactions in Beutel Goodman’s flagship U.S. equity portfolio.
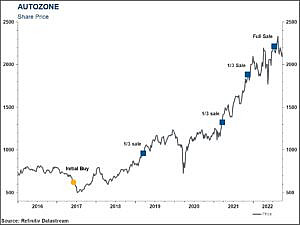
Source: Refinitiv Eikon, Beutel Goodman
SMC Corp.
Industrials, and particularly long-life machinery, are popular tools for implementing macroeconomic strategies, given their expected predictability around business cycles. These predictions can quickly backfire, however, as a company’s fundamentals can deviate from macro trends. This could be due to end markets, for example, where demand for construction machinery, as an example, is growing or shrinking, while pumping equipment does the opposite. In the case of SMC Corp., our fundamental research assessed its business model and competitive moat as almost incomparable to typical machinery companies, which allowed the firm to prosper through an overall downturn in the industry.
We purchased shares in SMC in Q4/2018, following a significant sell-off in the stock that saw shares tumble 40% from their peak in February 2018. SMCis one of only two global leaders in pneumatic component manufacturing, with #1 or #2 market shares in every global region. Pneumatic components play an important role in factory automation — a dominant theme in modern manufacturing’s ongoing pursuit of higher performance and better efficiency through technological and engineering innovation.
SMC manufactures industrial pneumatic components in virtually every machine and on a wide breadth of production lines, from auto assembling to beverage bottling, and from semiconductor chip-making to clinical lab testing. As these components are used in automated production processes on a continuous basis, and are subject to constant wear and tear, they need to be replaced regularly. SMC commands over 30% of global market share in pneumatic components and is about 50% larger than its closest global competitor.
Our thesis was informed by an in-depth understanding of the company’s broad product lineup, vertically integrated production network, rise to global prominence and the long-term sustainability of its dominant market position. Its scale and technological leadership had helped SMC maintain strong client relationships throughout the value chain, as well as achieving consistently high margins and ROIC. As part of our research process, we discussed key issues with senior management on several occasions, including corporate development strategy, governance structure, capital allocation and executive compensation. In addition, we visited SMC’s core U.S. manufacturing facility in Noblesville, Indiana, where we discussed expansion plans for the U.S. market with the U.S. management team and gained valuable insights into the company’s operational management capability.
Economic sensitivities can be material for Industrials companies, especially in the long-life capital goods sector. Starting in early 2018, much of the investment world zeroed in on short-term economic weakness in emerging markets. In addition, currency weakness in Latin America and capital outflows in China caused a great deal of concern. Amid fear of a global slowdown, especially in emerging markets, which would mean a reduction of capital spending in factories, macro concerns started to impact the stock’s valuation in 2018.
This sell-off presented us with an opportunity to buy a company that met our high investment hurdles at an attractive price. Our research supported SMC’s competitiveness and long-term viability. Furthermore, we assessed that the company’s broad product offering and leading competitive positions, diversified end markets and solid financials would support it through difficult market conditions.
By late 2018, it appeared the market had abandoned its rosy outlook for automation-driven, pneumatic market growth, and basically assumed zero global demand growth in perpetuity. Meanwhile, in accordance with our disciplined equity process, these valuation levels appeared to provide a sufficient margin of safety to invest.
The stock proved volatile during our ownership period, primarily as a result of fluctuating market perception and sentiment regarding the company’s short-term prospects. The business environment became challenging for SMC and its peers in the second half of 2018. However, concerns for the collapse of factory automation did settle down and by 2019 SMC’s operating results reflected underlying end-market demand, and also demonstrated better resilience than many of its competitors. In particular, SMC’s broad and diversified end-market exposure shielded it from some of the volatility linked to demand swings. SMC continued to compete aggressively in its existing markets, while expanding in newer areas such as the U.S. to raise its global market share.
By the latter part of 2019, with news pointing to a moderation of global trade tensions, market sentiment turned positive quickly and factory automation stocks rallied. With strong operational results and a positive shift in market sentiment, SMC stock rerated and reached our target price, which prompted a process-driven 1/3 trim in November 2019. In early 2020, SMC stock held up well against a volatile market backdrop in a chaotic global economic environment as many of its peers and end customers suffered severe downturns. A big part of the stock’s performance can be attributed to SMC’s resilient operating results through the pandemic months. We consequently conducted a second 1/3 trim in May 2020. Thereafter, and in accordance with our disciplined process, we liquidated the stock in November 2020 and used the proceeds as a source of funds for other opportunities.
Exhibit 5: SMC Corp. This chart shows the main transactions in Beutel Goodman’s flagship international equity portfolio
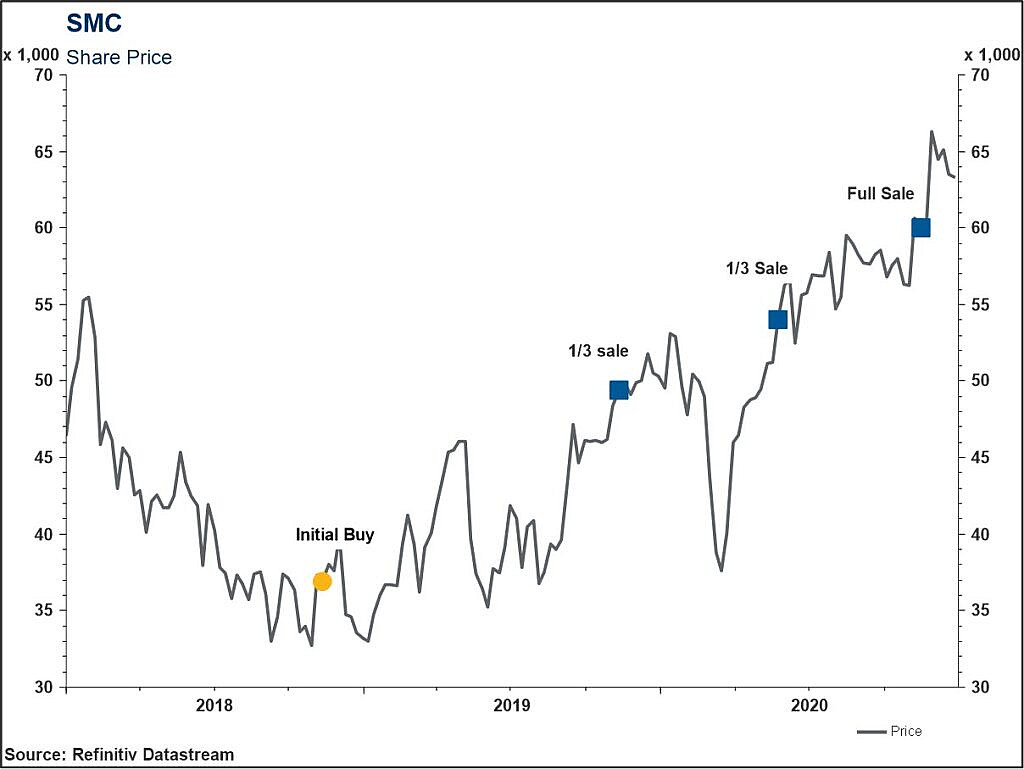
Source: Refinitiv Eikon, Beutel Goodman
In Summary
Our disciplined investment process is designed to focus on the areas where we have the best visibility and control. In our view, demonstrated business quality and attractive valuations improve our expectations of capital appreciation and downside protection. We also understand the economic sensitivities across the companies in our portfolios; however, we do not invest based on ever-changing top-down projections that may disrupt our fundamental company analysis. We seek to take advantage of investment anomalies, focusing on understanding the fundamentals of a company and not on unreliable macro forecasts or sweeping predictions. When solid businesses such as SMC and AutoZone were deeply discounted due to macro and big-picture trend assessments, we conducted our own fundamental research on the viability of the businesses, taking a long-term view and aiming to invest at a discount.
Our bottom-up, disciplined investment process has historically served our clients well. That’s not to say that every investment decision we make fulfills our expectations — a 100% strike rate is a fantasy in investing and cricket. Instead, our commitment to focusing on company fundamentals and managing downside risk means that while companies, markets or the economy may fall on hard times, we always stay the course.
Download PDF
Related Topics and Links of Interest:
©2023 Beutel, Goodman & Company Ltd. Do not sell or modify this document without the prior written consent of Beutel, Goodman & Company Ltd. This document represents the views of Beutel, Goodman & Company Ltd. as at the date indicated.
This document is not intended, and should not be relied upon, to provide legal, financial, accounting, tax, investment or other advice.
The index information contained in this document has been obtained from sources believed to be reliable, but we do not represent that it is accurate or complete and it should not be relied upon as such.
The S&P 500 data (“Index”) is a product of S&P Dow Jones Indices LLC and has been licensed for use by Beutel, Goodman & Company Ltd. All rights reserved. S&P 500® is a registered trademark of Standard & Poor’s Financial Services LLC (“S&P”). Neither S&P Dow Jones Indices LLC or S&P, their affiliates nor their third party licensors make any representation or warranty, express or implied, as to the ability of any index to accurately represent the asset class or market sector that it purports to represent and none such entities shall have any liability for any errors, omissions, or interruptions of any index or any data related thereto.
Neither MSCI nor any other party involved in or related to compiling, computing or creating the MSCI data makes any express or implied warranties or representations with respect to such data (or the results to be obtained by the use thereof), and all such parties hereby expressly disclaim all warranties of originality, accuracy, completeness, merchantability or fitness for a particular purpose with respect to any such data. Without limiting any of the foregoing, in no event shall MSCI, any of its affiliates, or any third party involved in or related to compiling, computing or creating the data have any liability for any direct, indirect, special, punitive, consequential or any damages (including lost profits) even if notified of the possibility of such damages. No further distribution or dissemination of the MSCI data is permitted without MSCI’s express written consent.
Certain portions of this document may contain forward-looking statements. Forward-looking statements include statements that are predictive in nature, that depend upon or refer to future events or conditions, or that include words such as “expects”, “anticipates”, “intends”, “plans”, “believes”, “estimates” and other similar forward-looking expressions. In addition, any statement that may be made concerning future performance, strategies or prospects, and possible future action, is also forward-looking statement. Forward-looking statements are based on current expectations and forecasts about future events and are inherently subject to, among other things, risks, uncertainties and assumptions which could cause actual events, results, performance or prospects to be incorrect or to differ materially from those expressed in, or implied by, these forward-looking statements.
These risks, uncertainties and assumptions include, but are not limited to, general economic, political and market factors, domestic and international, interest and foreign exchange rates, equity and capital markets, business competition, technological change, changes in government regulations, unexpected judicial or regulatory proceedings, and catastrophic events. This list of important factors is not exhaustive. Please consider these and other factors carefully before making any investment decisions and avoid placing undue reliance on forward-looking statements Beutel Goodman has no specific intention of updating any forward-looking statements whether as a result of new information, future events or otherwise.
