23 March 2026
Summary
In this piece, the Fixed Income Team explores whether bonds behave like bananas (ie, commodities). The article examines when fixed income markets exhibit commodity-like dynamics driven by shifts in supply and demand, and when yields are primarily anchored by fundamentals such as the expected path of policy rates, and the inflation and growth outlook.
by Beutel Goodman Fixed Income Team
One of the basic foundations of neoclassical economic theory is that commodities are priced at the intersection of supply and demand. Because supply can shift suddenly with weather, outages or logistics, it often drives the largest price swings. In commodities such as bananas, plentiful harvests can push prices down, while droughts and other supply shocks can push prices up.
The question is whether bonds behave in the same way. Are bonds like bananas?
At times, fixed income markets can exhibit commodity-like dynamics, with net issuance and shifting buyer bases forcing prices to adjust. However, yields, in theory, should be anchored by fundamentals: the expected path of policy rates, the inflation and growth outlook, and the term premium. Distinguishing where supply and demand dominate, and where macro fundamentals dominate, has been essential to understanding fixed income performance over the past year, and provides a useful lens for what may matter most in 2026.
Developed Market Sovereign Bonds: Fundamentals First, Flows Second
In developed market sovereigns, yields may temporarily dislocate on supply dynamics; however, we believe that over the medium to long term, prices are not set the way commodities are. Instead, the level of rates is anchored by fundamentals and the macro regime. A useful framing is to decompose sovereign yields into three components: expected path of real policy rates, long-run economic expectations and term premium (compensation for uncertainty around inflation and interest-rate volatility).
At the front end of the curve, the dominant force is the expected policy path. Short-term yields reflect the market’s forecast of the central bank reaction function, how policy will respond to growth and inflation. This is why, in risk-off periods, yields often fall even as deficits widen and issuance rises; the market is pricing weaker growth, lower inflation pressure and an easier policy path.
At the long end of the curve, yields reflect long-run economic expectations for inflation and growth, and term premium. These are shaped more by the issuer’s economic and institutional landscape, inflation credibility, productivity, demographics and policy framework, than by the mechanical volume of debt issued. Importantly, deficits are often countercyclical. Fiscal support tends to rise when growth expectations are muted, so larger deficits can coexist with falling yields when investors are pricing weaker demand and contained inflation.
That said, marginal dislocations are real. Auctions, refundings, sudden deficit revisions or abrupt shifts in the buyer base can require a concession; episodes like the UK gilt shock and bouts of volatility in the Japanese bond market show how quickly the market can move when it needs to clear the marginal buyer. But unless the episode changes the macro regime, these moves tend to mean revert as fundamentals, and fundamental buyers, reassert as seen in both the UK and Japan recently.
Substitutability: Why Some Bonds Trade Like Commodities
Does that mean bond prices are never set by the invisible hand, and that issuance can rise without limit as long as an issuer’s fundamentals remain sound? Not quite. Bonds start to look like commodities when investors can rotate between close substitutes as prices move.
Developed market sovereigns, however, generally fail the substitutability test because they play an institutional role and have structural buyers. There is no true substitute for high-quality government bonds that function simultaneously as a store of value, a liquid hedge and a foundational piece of collateral. The result is a buyer base that is often less price sensitive; banks holding high-quality liquid assets for regulatory and liquidity needs, pensions and insurers matching long-dated liabilities, foreign central banks holding reserves for policy objectives, and private investors who need collateral. Home bias reinforces this further: many buyers have a preference, or an explicit mandate, to own domestic government securities regardless of near-term valuation.
Substitution across developed market sovereigns is also more limited than headline yields suggest because the relevant return for many foreign investors is the currency-hedged yield, not the unhedged yield. When FX hedging costs rise, the yield advantage can disappear. As a result, the highest unhedged yield does not necessarily attract incremental flows.
Emerging market sovereigns are closer to where commodity-like characteristics show up, because substitution is real and the marginal buyer is more price sensitive. In emerging market (EM) debt markets, investors rotate across countries, currencies and risk buckets, and capital can move quickly when relative compensation changes. In that setting, net issuance and flows can have a more direct and persistent influence on yields, because the buyer base is more elastic and the market often requires a clearer concession to absorb supply. This focus on relative value through substitution is much more akin to credit markets than developed market (DM) sovereign markets.
Credit Supply/Demand Dynamics
Like EM Bond Markets, credit markets are often defined by supply/demand dynamics and a price-sensitive marginal buyer. Investors can rotate across corporates, agencies, provinces and securitized credit, as well as across ratings, structures and maturities within each sector. That menu of alternatives makes demand more elastic and spreads more sensitive to the balance of supply and demand, particularly when flows are driving marginal price action. This technical dynamic was an important factor driving the tightness of credit spreads over the past couple of years.
The Canadian corporate bond supply backdrop in 2025 was unusually heavy. Gross issuance hit a record, driven by a large maturity calendar that required refinancing alongside new money borrowing, and a broader issuer base that included many first-time bond issuers. But gross supply overstates what the market must absorb. In credit, what matters is net supply: the amount of new paper that remains after maturities, tenders, buybacks and redemptions. This distinction mattered in 2025 because, while gross issuance was record-setting, net supply was more modest, especially in certain pockets such as longer-dated maturities.
In 2025, net supply was not only met but exceeded by record demand, with investor capital in Canadian fixed income nearly tripling over the past decade (source: Securities and Investment Management Association). Higher all-in yields pulled investors back into fixed income after years of low yields, rebuilding allocations across sectors. At the same time, higher coupon levels added to demand as cash flows were recycled back into the market. Asset price appreciation also expanded the pool of capital available to allocate, and some of that incremental liquidity found its way into corporate bonds. In parallel, issuer actions such as buybacks and tender offers reduced net supply; this tightened the supply and demand balance in favour of tighter spreads.
The implication is straightforward. When demand is strong, spreads can tighten even in heavy issuance years, if demand exceeds net supply. The chart below shows that demand has exceeded supply over the last several years and has been a contributing factor to increasingly driving spreads tighter.
Chart 1: Canadian Net Bond Supply and Option Adjusted Spreads (OAS). This chart shows that excess bond supply or shortfall is correlated with year-end OAS of the Bloomberg Canada Baa Index. As net supply rises, OAS also rises and as supply enters a shortfall, downward pressure is exerted on spreads. There are three net issuance scenarios for 2026: Scenario 1) Medium net supply scenario, inflows equal the average of the last 8 years; Scenario 2) Net supply shortfall, bond inflows continue at 2025 levels; and Scenario 3) High net supply scenario, outflows from bonds.
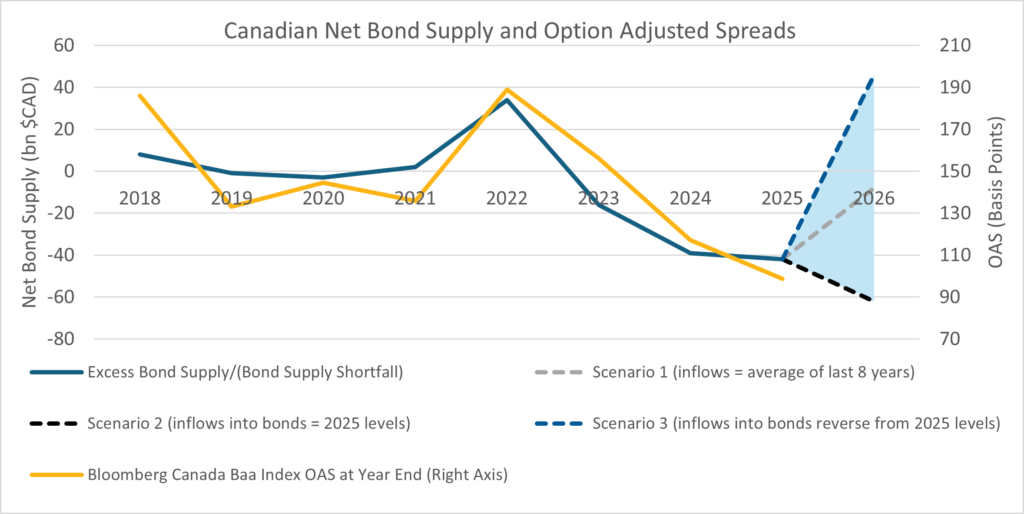
Sources: Securities and Investment Management Association, Bloomberg L.P., Beutel Goodman. Data as of Dec 31, 2025.
Evidence of these supply and demand dynamics shows up not only in spread levels, but also in real-time indicators such as new issue concessions, order book strength and the breadth of the buyer base. When concessions compress and order books deepen, the market is signaling that demand is absorbing supply with little need for additional price incentive. In credit, technicals can keep spreads tighter for longer than fundamentals alone would suggest.
The risk is a reversal in those technicals. If flows into fixed income weaken, while refinancing needs and new money issuance remain elevated, spreads can leak wider, new issue concessions can reappear and dispersion can rise as the market becomes more selective about which risks it is willing to absorb and at what price. In credit, unlike rates, supply and demand can set the clearing price for extended periods, which is why credit is where bonds most consistently behave like commodities.
Bond Technicals and the Curve
Circling back to developed market sovereigns, it is important to note that these markets are not immune to supply and demand dynamics. The difference is where those forces show up. In sovereigns, supply and demand tends to express itself more subtly through the shape of the curve, not the outright level of rates. While many investors are structural holders of government bonds and do not have the same cross country or cross asset substitutability that exists in other sectors, they can often choose between tenors (ie, the remaining time until maturity). In doing so, they effectively set how much compensation they demand for holding duration, in other words, the term premium.
Supply shocks around individual auctions are usually short lived, a drop in the bucket. Over time, however, flow can become stock. Persistent deficits accumulate into a larger stock of debt and a larger stock of duration that must be held by the private sector. That can lift term premia if investors demand greater compensation for inflation uncertainty, policy uncertainty and the risk that fiscal needs begin to influence the policy mix.
This is why the curve implication can be more visible than the level implication. A larger debt burden can actually keep rates more anchored at the front end. Higher debt service costs as a share of GDP can compress fiscal capacity and increase sensitivity to higher rates, which can keep front end rates low. In that sense, the imprint of a large debt load often shows up as a steeper curve, higher term premia at the back end, rather than simply higher rates everywhere.
Central bank balance sheet policy is another channel through which supply and demand dynamics show up in the curve. Through quantitative easing (QE), central banks purchased bonds and removed a meaningful stock of duration from private hands, compressing term premia and flattening the curve. Thus, QE’s distinct footprint during the 2010s was the shape of the curve, keeping long-term rates depressed. Meanwhile, the absolute low level of rates across the curve reflected prolonged zero lower-bound expectations and a low neutral-rate environment. Quantitative tightening does the opposite: it increases the supply or duration the market must absorb, even if the expected policy path is unchanged and thus steepens curves.
The implication for today’s regime is that the ‘run it hot’ fiscal posture we are in (when governments intentionally use expansionary measures, such as high deficit spending and tax cuts, to keep the economy operating at maximum capacity, with countries such as the U.S. running a 5-6% deficit to GDP) is likely to matter more for curve shape than for outright yield levels. Persistent issuance, alongside balance sheet run-off, influences how much compensation investors require to hold long duration. In practical terms, this points to ongoing upward pressure on term premia and a bias toward steeper curves, even if front-end rates remain anchored by the macro outlook and policy expectations.
Key Takeaways for 2026
In summary, most of the time, sovereign bonds are not like bananas. Over the long run, yields are anchored by macro fundamentals and policy expectations, while supply and demand tends to show up through term premia and curve shape. We expect the current elevated government deficits to show up in structurally steeper curves. Credit is more commodity-like because substitution is real and flows can set spreads at the margin for extended periods. As we continue to navigate corporate bond markets in 2026, we will focus on net supply and fund flows. We will watch for signals such as rising new issue concessions and widening dispersion, which suggest demand is no longer absorbing supply as easily.
Download PDF
Related Topics and Links of Interest:
©2026 Beutel, Goodman & Company Ltd. Do not sell or modify this document without the prior written consent of Beutel, Goodman & Company Ltd. This commentary represents the views of Beutel, Goodman & Company Ltd. as at the date indicated. This document is not intended, and should not be relied upon, to provide legal, financial, accounting, tax, investment or other advice.
Certain portions of this report may contain forward-looking statements. Forward-looking statements include statements that are predictive in nature, that depend upon or refer to future events or conditions, or that include words such as “expects”, “anticipates”, “intends”, “plans”, “believes”, “estimates” and other similar forward-looking expressions. In addition, any statement that may be made concerning future performance, strategies or prospects, and possible future action, is also forward-looking statement. Forward-looking statements are based on current expectations and forecasts about future events and are inherently subject to, among other things, risks, uncertainties and assumptions which could cause actual events, results, performance or prospects to be incorrect or to differ materially from those expressed in, or implied by, these forward-looking statements.
These risks, uncertainties and assumptions include, but are not limited to, general economic, political and market factors, domestic and international, interest and foreign exchange rates, equity and capital markets, business competition, technological change, changes in government regulations, unexpected judicial or regulatory proceedings, and catastrophic events. This list of important factors is not exhaustive. Please consider these and other factors carefully before making any investment decisions and avoid placing undue reliance on forward-looking statements Beutel Goodman has no specific intention of updating any forward-looking statements whether as a result of new information, future events or otherwise.
