This is confidential for internal use by advisors only. Not for external distribution to an investor or potential investor.
The Case for Global Investing
Why today?
Global diversification remains a powerful tool for improving portfolio resilience and longterm return potential. And the current environment strengthens the case for an allocation to global equity strategies.
Take advantage of significant valuation gaps between growth and value stocks.
Provide real cash flow protection with stocks offering robust balance sheets and resilient cash flows.
Reduce concentration risk inherent in the S&P 500 (tech stocks) and the S&P/TSX (materials, energy).
Beutel Goodman Unique Value Process
Disciplined, bottom-up value investor
Concentrated, conviction-weighted portfolio
Preservation of capital is paramount
Research-driven buy / sell process seeks to capture upside and mitigate risk
Beutel Goodman Global Equity Lineup
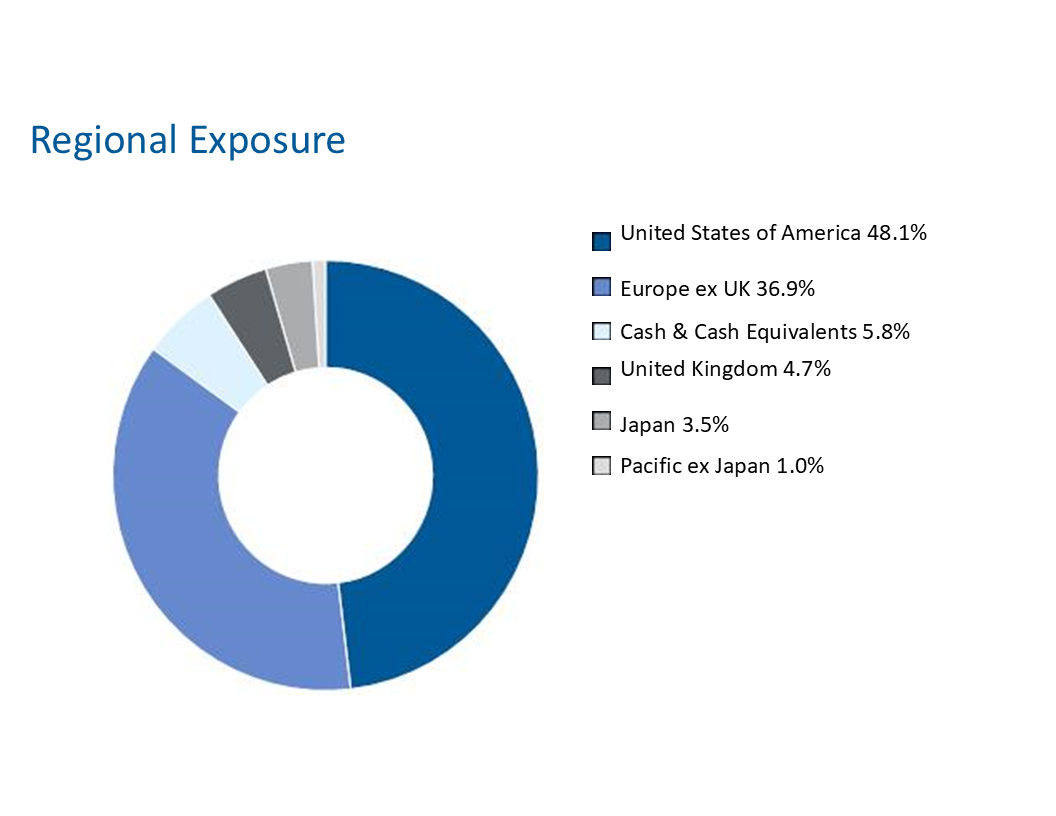
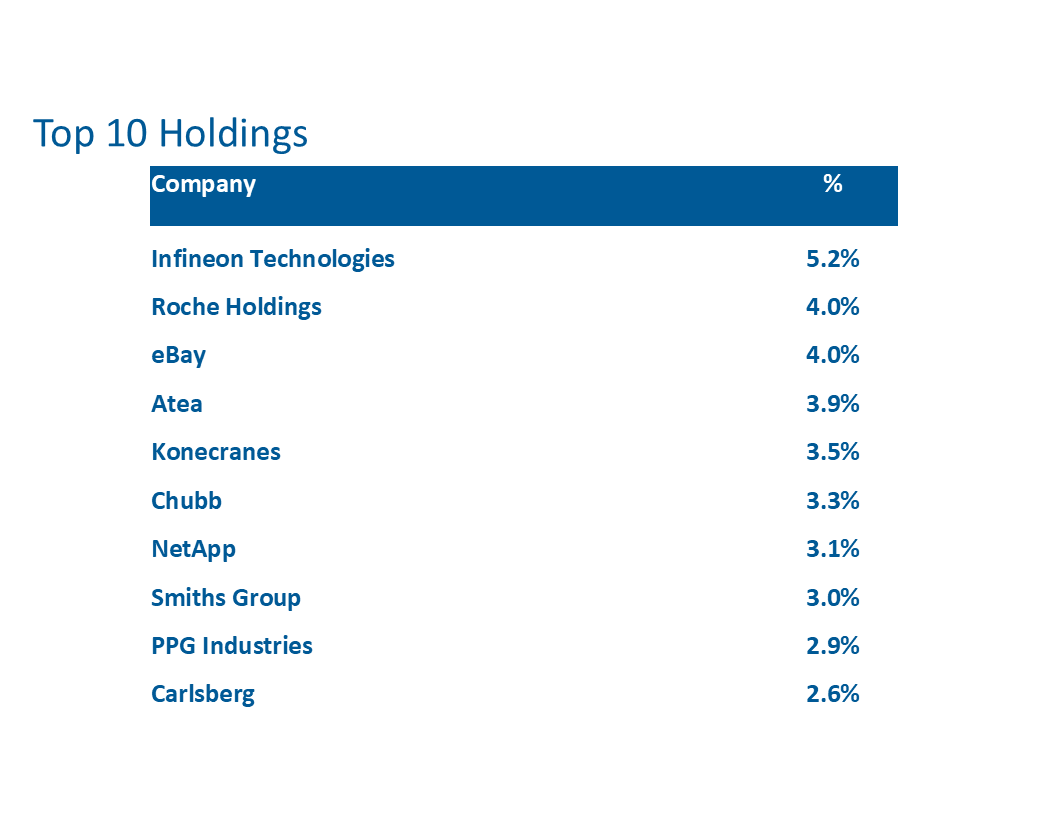
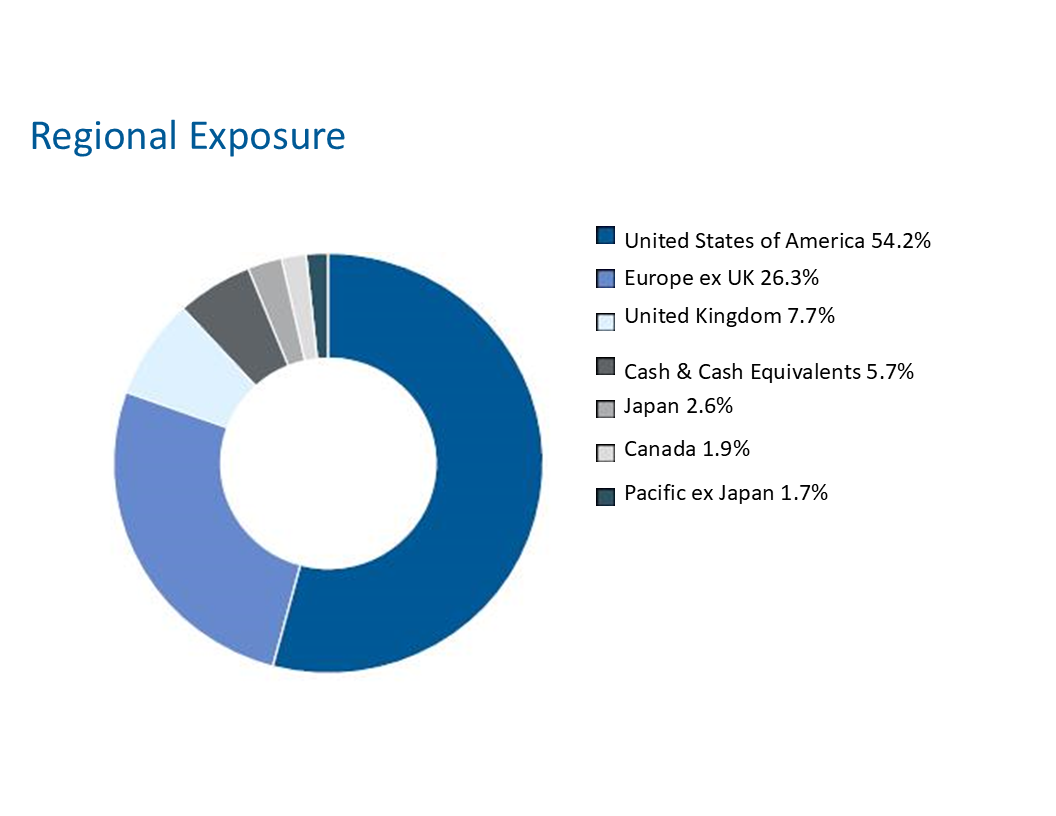
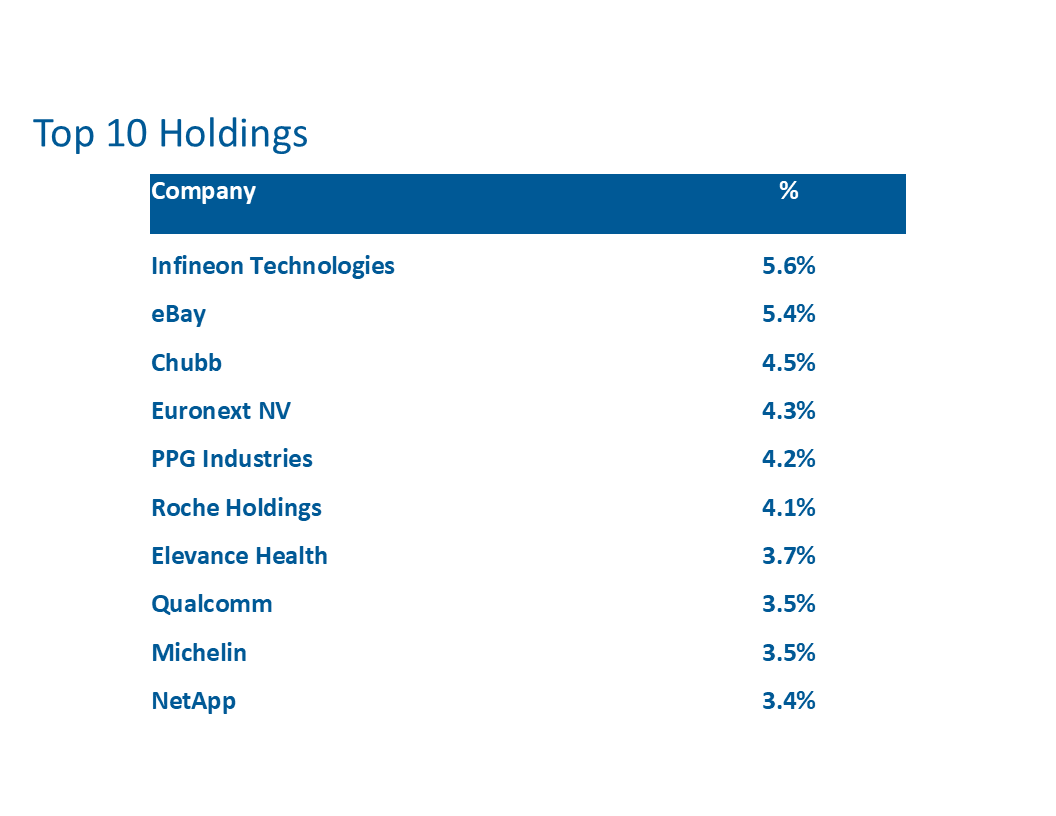
Global Equity Fund
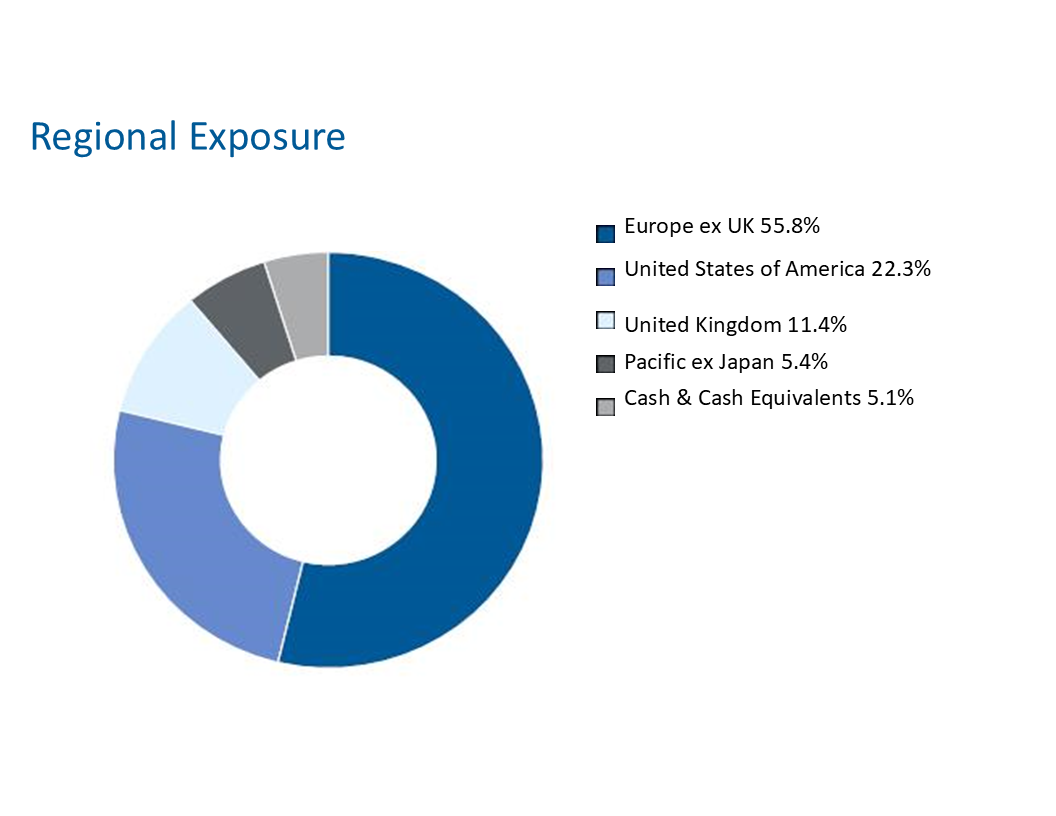
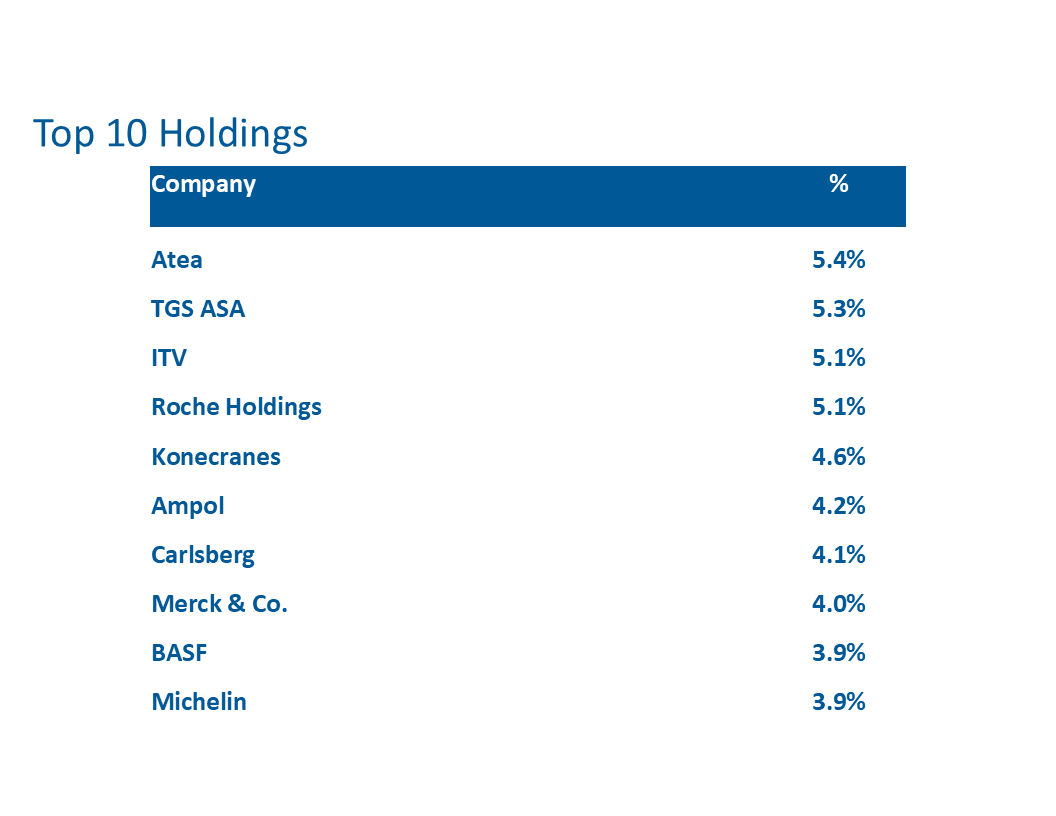
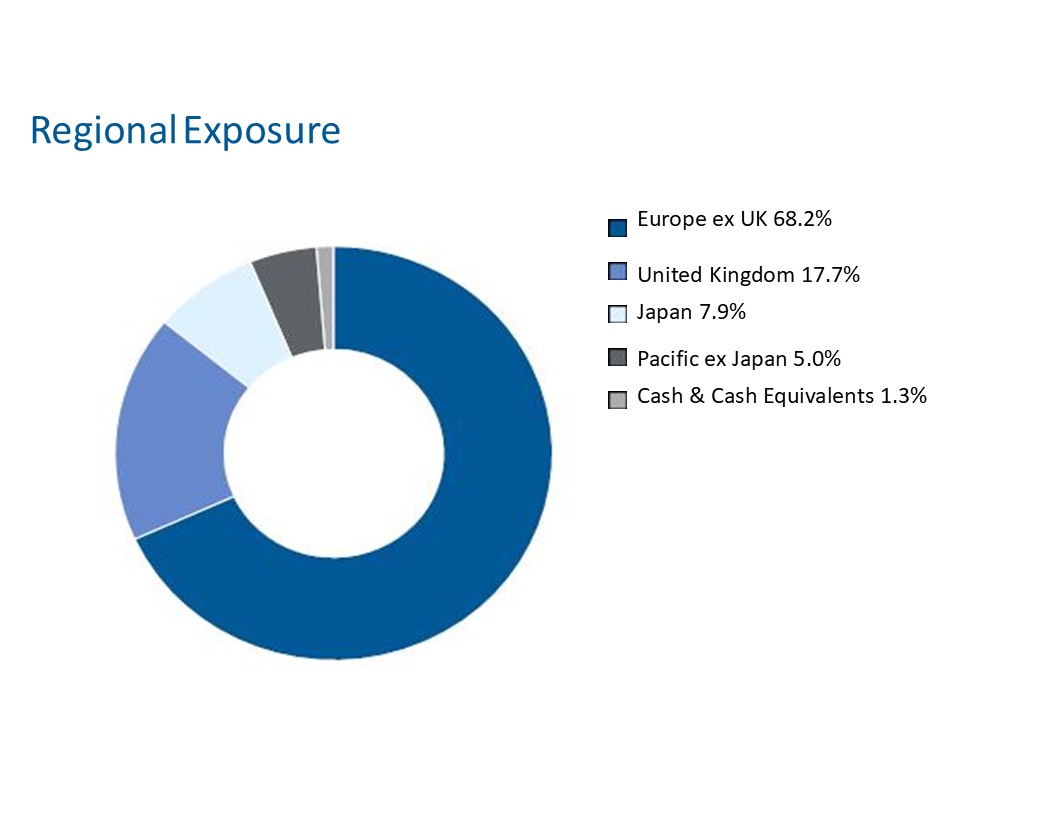
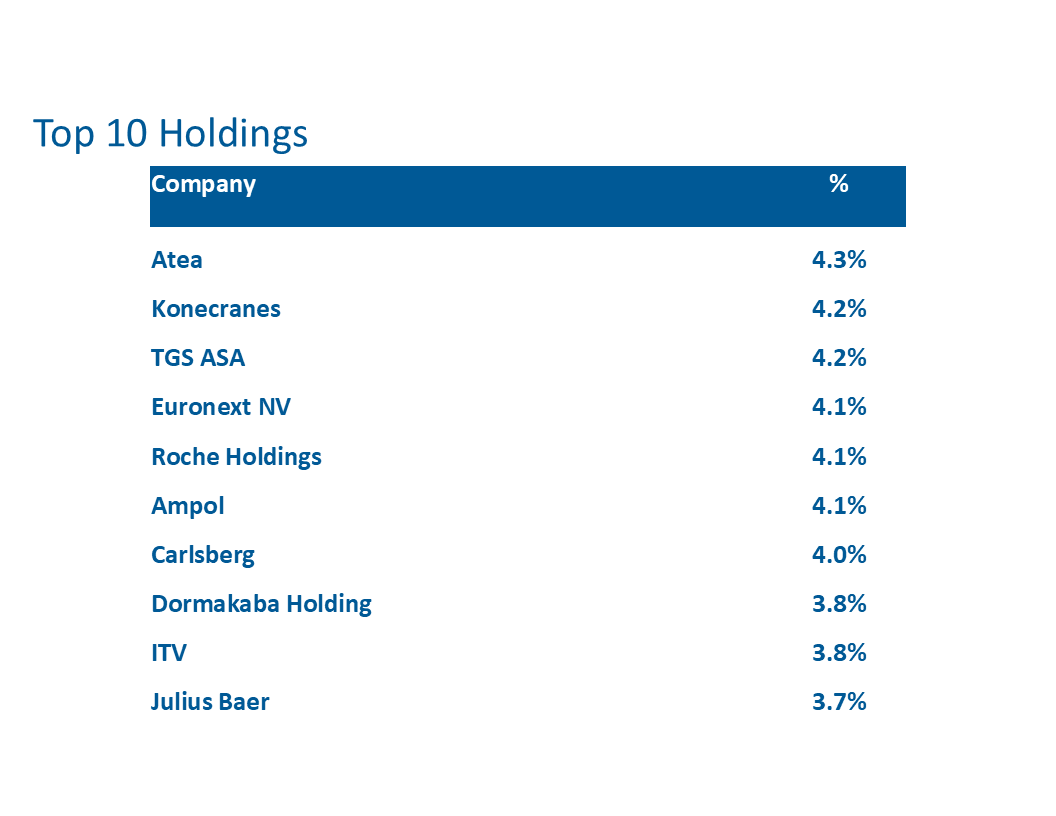
International Equity Fund
Global Dividend Fund
World Focus Equity Fund
Class F MER (%) 1.27
| QTD | Y1R | Y3R | Y5R | Y7R | Y10R | |
|
Beutel Goodman Global Equity Fund Class F MSCI World Net Index (CAD) |
10.70% 13.10% |
16.46% 27.73% |
14.50% 22.43% |
8.36% 14.94% |
10.50% 15.20% |
9.69% 13.66% |
As at May 31, 2026
Class F MER (%) 1.29
| QTD | Y1R | Y3R | Y5R | Y7R | Y10R | |
|
Beutel Goodman Global Dividend Fund Class F MSCI World Net Index (CAD) |
6.53% 13.10% |
21.90% 27.73% |
13.47% 22.43% |
8.90% 14.94% |
10.60% 15.20% |
9.58% 13.66% |
Class F MER (%) 1.13
| QTD | Y1R | Y3R | Y5R | Y7R | Y10R | |
|
Beutel Goodman International Equity Fund Class F MSCI EAFE Net Index (CAD) |
8.76% 9.32% |
20.12% 23.03% |
15.97% 18.68% |
8.46% 11.68% |
9.69% 11.09% |
8.81% 9.82% |
As at May 31, 2026
Class F MER (%) 1.13
| QTD | Y1R | Y3R | Y5R | Y7R | Y10R | |
|
Beutel Goodman World Focus Equity Fund Class F MSCI World Value Net Index (CAD) |
12.08% 8.16% |
18.22% 25.93% |
13.31% 19.79% |
9.03% 13.21% |
10.67% 11.85% |
10.02% 10.62% |
As at May 31, 2026
Numbers may not add to 100% due to rounding. Past performance does not guarantee future results. Invested capital is at risk of loss. Any securities, sectors or allocations listed should not be perceived as investment recommendations and may no longer be held in an account's portfolio.
The index information contained on this page has been obtained from sources believed to be reliable, but we do not represent that it is accurate or complete and it should not be relied upon as such.
The S&P/TSX Index data (“Index”) is a product of S&P Dow Jones Indices LLC and TSX Inc. and has been licensed for use by Customer. All rights reserved. S&P® is a registered trademark of S&P. Dow Jones® is a registered trademark of Dow Jones Trademark Holdings LLC (“Dow Jones”). TSX® is a registered trademark of TSX Inc. Neither S&P Dow Jones Indices LLC, S&P, Dow Jones, TSX Inc., their affiliates nor their third party licensors make any representation or warranty, express or implied, as to the ability of any index to accurately represent the asset class or market sector that it purports to represent and none such entities shall have any liability for any errors, omissions, or interruptions of any index or any data related thereto.
