Summary
• Canada has been trading stocks since the middle of the 19th century and has been home to some of the world’s most highly regarded companies over the years.
• The Canadian equity market is significantly weighted to Financials and Energy relative to global markets, which could lead to elevated security and sector concentration for passive investors.
• Some institutional investors have sought to reduce risk and improve returns through greater geographic diversification, but individual investors may have different investment objectives and obligations that support strong allocations to Canada in their portfolios.
• While the MSCI World Index’s Canada allocation is ~3%, an efficient frontier analysis of global equities suggests a weighting to Canada of between 9% and 31%.
By Beutel Goodman’s Canadian Equities Team
Advances in technology have made the world a much smaller place. That is certainly true in the investment industry, where global security trading is almost instantaneous and someone in Canada can buy stocks on the Shanghai, London or Bombay stock exchanges just as easily as the Toronto Stock Exchange.
The ease of international security trading doesn’t mean Canadian investors should neglect the domestic market, however. In this paper, we investigate some of the reasons why Canadian stocks remain an important component of many investment portfolios across Canada and detail our own process for selecting companies for the Beutel Goodman Canadian equity strategy.
Canada: Composition of an Export Economy
According to the World Federation of Exchanges, global market capitalization for equities stood at US$101.2 trillion at the end of 2023. Canada, represented by TMX Group (the Toronto Stock Exchange and TSX Venture Exchange), accounts for $4.5 trillion (US$3.3 trillion) in market cap, as at March 31, 2024.
Founded in 1861, the Toronto Stock Exchange (TSX) is the main equity exchange in Canada and has 1,787 issuers, as at March 31, 2024. Its main benchmark, the S&P/TSX Composite Index (S&P/TSX), is commonly used by investors to measure the strength of Canadian stocks.
Canada is a major exporter, with resources (particularly oil and gas) playing a crucial role in the performance of its economy, currency and equity market. With stable political and legal systems and abundant natural resources, Canada has long been an attractive destination for both domestic and international investors.
Another important element is Canada’s geography — it shares the longest land border on earth with the world’s largest economy and preeminent superpower, the United States of America (“U.S.”). The U.S. is also Canada’s main trading partner, and according to data from the Federal Government of Canada, Canada–U.S. trade exceeded $1.2 trillion in 2022, making Canada the largest trading partner of the U.S. for goods and services.
Data from the World Bank shows that exports of goods and services accounted for 33.8% of Canada’s GDP in 2022, compared to 25.4% for Australia, another nation where the resource sector plays a dominant role. It is worth noting that Canada has reduced its dependence on exports in recent years, having peaked at 44.2% of GDP in 2000.
Canada may be the second-largest country in the world by land mass, but with a population of just over 41 million (as of March 2024), access to the U.S. and other international markets is crucial for many of its most successful businesses. These include global leaders in their field, such as Magna International Inc. in the automotive industry and Canadian Pacific Kansas City Limited in railways, as well as the Big Five banks, which are highly regarded internationally for good governance (this reputation was enhanced during the Global Financial Crisis, when unlike the U.S. or U.K., Canada did not have to bail out any of its banks).
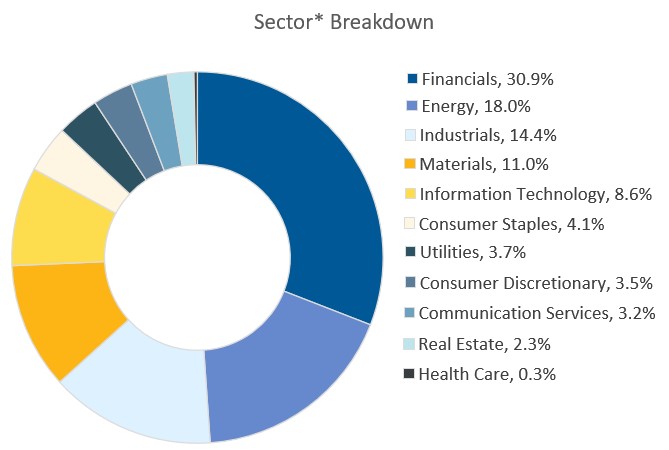
On the S&P/TSX, Financials is the dominant sector, with Energy next in terms of size, followed by Industrials, Materials and Information Technology.
Exhibit 1: S&P/TSX Composite Sector Concentration.
*Based on GICS® sectors. The weightings for each sector of the index are rounded to the nearest tenth of a percent; therefore, the aggregate weights for the index may not equal 100%.
Source: S&P Dow Jones Indices LLC. As at March 31, 2024.
When looking at the top 10 individual companies (measured by market cap) in the S&P/TSX, the Financials sector has the largest representation, while Shopify’s success has been a material factor in the growth of the Information Technology (IT) sector.
Exhibit 2: S&P/TSX Top 10 Holdings by Index Weight.
| Company | Ticker | Sector* |
| Royal Bank of Canada | RY | Financials |
| Toronto-Dominion Bank | TD | Financials |
| Shopify Inc. | SHOP | Information Technology |
| Canadian Pacific Kansas City Limited | CP | Industrials |
| Canadian Natural Resources Limited | CNQ | Energy |
| Enbridge Inc | ENB | Energy |
| Canadian National Railways | CNR | Industrials |
| Bank of Montreal | BMO | Financials |
| The Bank of Nova Scotia | BNS | Financials |
| Brookfield Corporation | BN | Financials |
Source: S&P Dow Jones Indices LLC. As at March 31, 2024.
The S&P/TSX is significantly overweight in Financials and Energy compared to global markets, and underweight in IT, Health Care and Consumer Discretionary. For a passive investor, these factors could lead to elevated security and sector concentration.
Amid a World of Choice, Factors for a Canadian Allocation
An important development in recent decades has been the movement away from Canadian stocks by domestic institutional investors. Up until 1990, Canadian pension plans were required to invest 90% of their assets in Canada, but this allocation was gradually reduced, and in 2005, the Foreign Property Rule was eliminated altogether. This change resulted in the allocation to Canadian equities among defined benefit pension plan sponsors falling from approximately 23% in 1990 to 4.3% by 2022 (source: Pension Investment Association of Canada).
Pension plans and other institutional investors have sought to reduce risk and improve returns through greater geographic diversification. This change has been a major driver toward investing in U.S., international and emerging markets, and more recently, diversifying investments in alternative asset classes (source: Kumar, Arun A.: “The World Is Not Enough? Expanding the Boundaries of International Equity Indices for International Investing”, MSCI Barra Research Insights, July 2008). It is worth noting, however, that typically there are significant differences in the investment objectives and obligations of institutional investors compared to individual investors.
Diversification is undoubtedly an important element of any portfolio, but it is also important for investors to fully understand the risks of investing abroad, as well as the benefits of maintaining an investment allocation in Canada.
Understanding the Risks
There are certain risks associated with investing abroad, including:
- Potential hidden costs — Some stock markets (South Korea and India are examples) impose a tax on equity transactions.
- Currency risk — Volatility in foreign exchange markets can hinder an investment portfolio’s return potential (regardless of the performance of its underlying holdings).
- Geopolitical or economic instability — Some countries may not have fully developed or stable political, legal or regulatory systems, which can contribute to volatility and risk; for example, in emerging markets.
- Taxation — Tax policies often encourage domestic investment. For example, for Canadian residents using a non-registered investment account, dividends paid by Canadian stocks are taxed more efficiently than those from a foreign company, which are not eligible for a dividend tax credit.
Canada is also generally regarded as a safe place to do business, owing to its developed rule of law and stable political and regulatory environment. There are also many leading Canadian companies that provide global exposure and diversification through their business activities. It is our view that considering the risks outlined above and the relative benefits in Canada, there are many reasons for investors to maintain a significant investment allocation to Canada.
The Efficient Frontier
Given the variety of investment options available, many investors may ask what the most efficient geographical mix is for a diversified investment portfolio and what the optimal weight should be to Canadian equities.
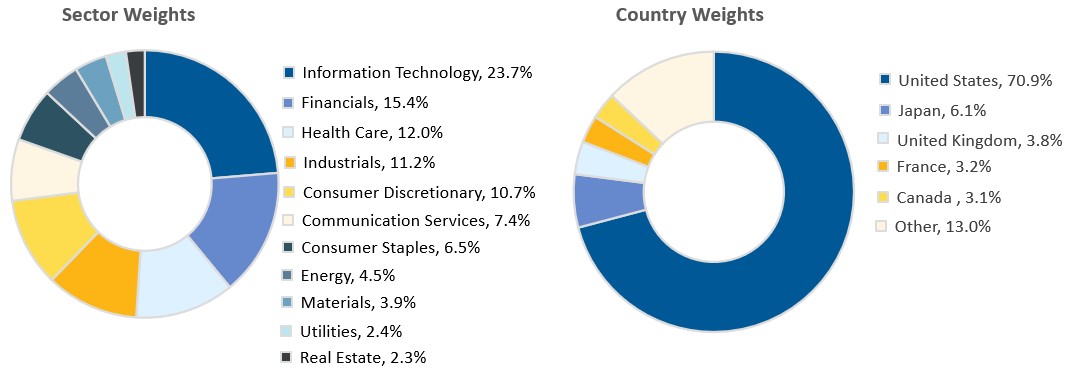
We live in a global marketplace, and Canada is a small piece of the pie available to investors, accounting for only 3.1% (as at March 31, 2024) of the MSCI World Index. This index captures large- and mid-cap representation across 23 developed market countries. Not surprisingly, the U.S. dominates, with 70.9% of the index. Among sectors, the global tech sector at 23.7% reflects the influence Silicon Valley has over equity markets worldwide.
Exhibit 3: MSCI World Index Breakdown (US$)
Source: MSCI World Index Factsheet. As at March 31, 2024.
To help explore what the most efficient geographical mix is, we optimized two hypothetical portfolios using the underlying components of the MSCI World Index to see if the portfolios could have a better risk-return profile than the index. The foundations of the analysis come from modern portfolio theory, which was introduced by American economist Henry Markowitz in 1952 as a method to help investors minimize market risk while maximizing returns. The basis of the theory is to use security, sector and country diversification to create more “efficient” portfolios.
Our “optimized portfolios” are comprised of three parts: U.S. equity (proxied by the S&P 500 Index); Canadian equity (S&P/TSX Composite Index); and Europe, Australasia, and the Far East, collectively known as EAFE (MSCI EAFE Index) over a 20-year period ending March 31, 2024.
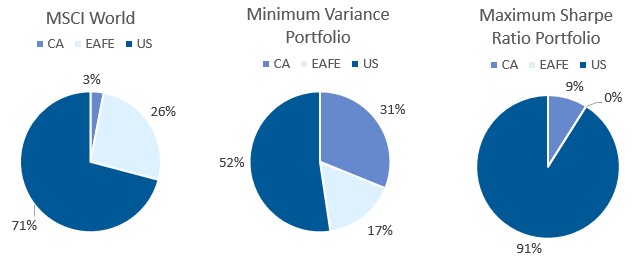
The results generated the two optimized portfolios shown below in Exhibit 4:
- The portfolio that minimizes risk, called the Minimum Variance Portfolio, which consists of 52% U.S. equity, 31% Canadian equity and 17% EAFE; and
- The portfolio that maximizes risk-adjusted returns, called the Maximum Sharpe Ratio Portfolio, which consists of 91% U.S. equity and 9% Canadian equity.
As detailed in Exhibits 4 and 5, both optimized portfolios have a higher weight in Canadian equity compared to the MSCI World Index and show a marked improvement over the risk-return profile of the MSCI World Index. They both have superior 20-year historical returns, lower standard deviation (which measures risk) and higher Sharpe ratios (which measures risk-adjusted performance) than the MSCI World Index.
Exhibit 4. Portfolio Geographic Breakdowns of the MSCI World Index and the Efficient Portfolios
Sources: Beutel, Goodman & Company Ltd., Bloomberg L.P. As at March 31, 2024.
Exhibit 5: Index Performance and Risk (20-Year Period: March 2004 to March 2024). The table below shows the performance and associated risk of the MSCI World Index, the Minimum Variance Portfolio and the Maximum Sharpe Ratio Portfolio over the 20-year period to March 31, 2024. The Minimum Variance Portfolio and Maximum Sharpe Ratio Portfolio compare favourably in terms of risk and returns with the MSCI World Index.
| MSCI World | Minimum Variance Portfolio | Maximum Sharpe Ratio Portfolio | |
| Average Returns | 8.26% | 8.81% | 10.09% |
| Standard Deviation | 0.116 | 0.110 | 0.115 |
| Sharpe Ratio | 0.59 | 0.67 | 0.75 |
| *For the 20-year period, from March 2004 to March 2024. Assumed risk-free rate is 1.41%; the average of the FTSE Canada 91 Day T-Bill rate during the historical period. | |||
Source: Bloomberg L.P. As at March 31, 2024
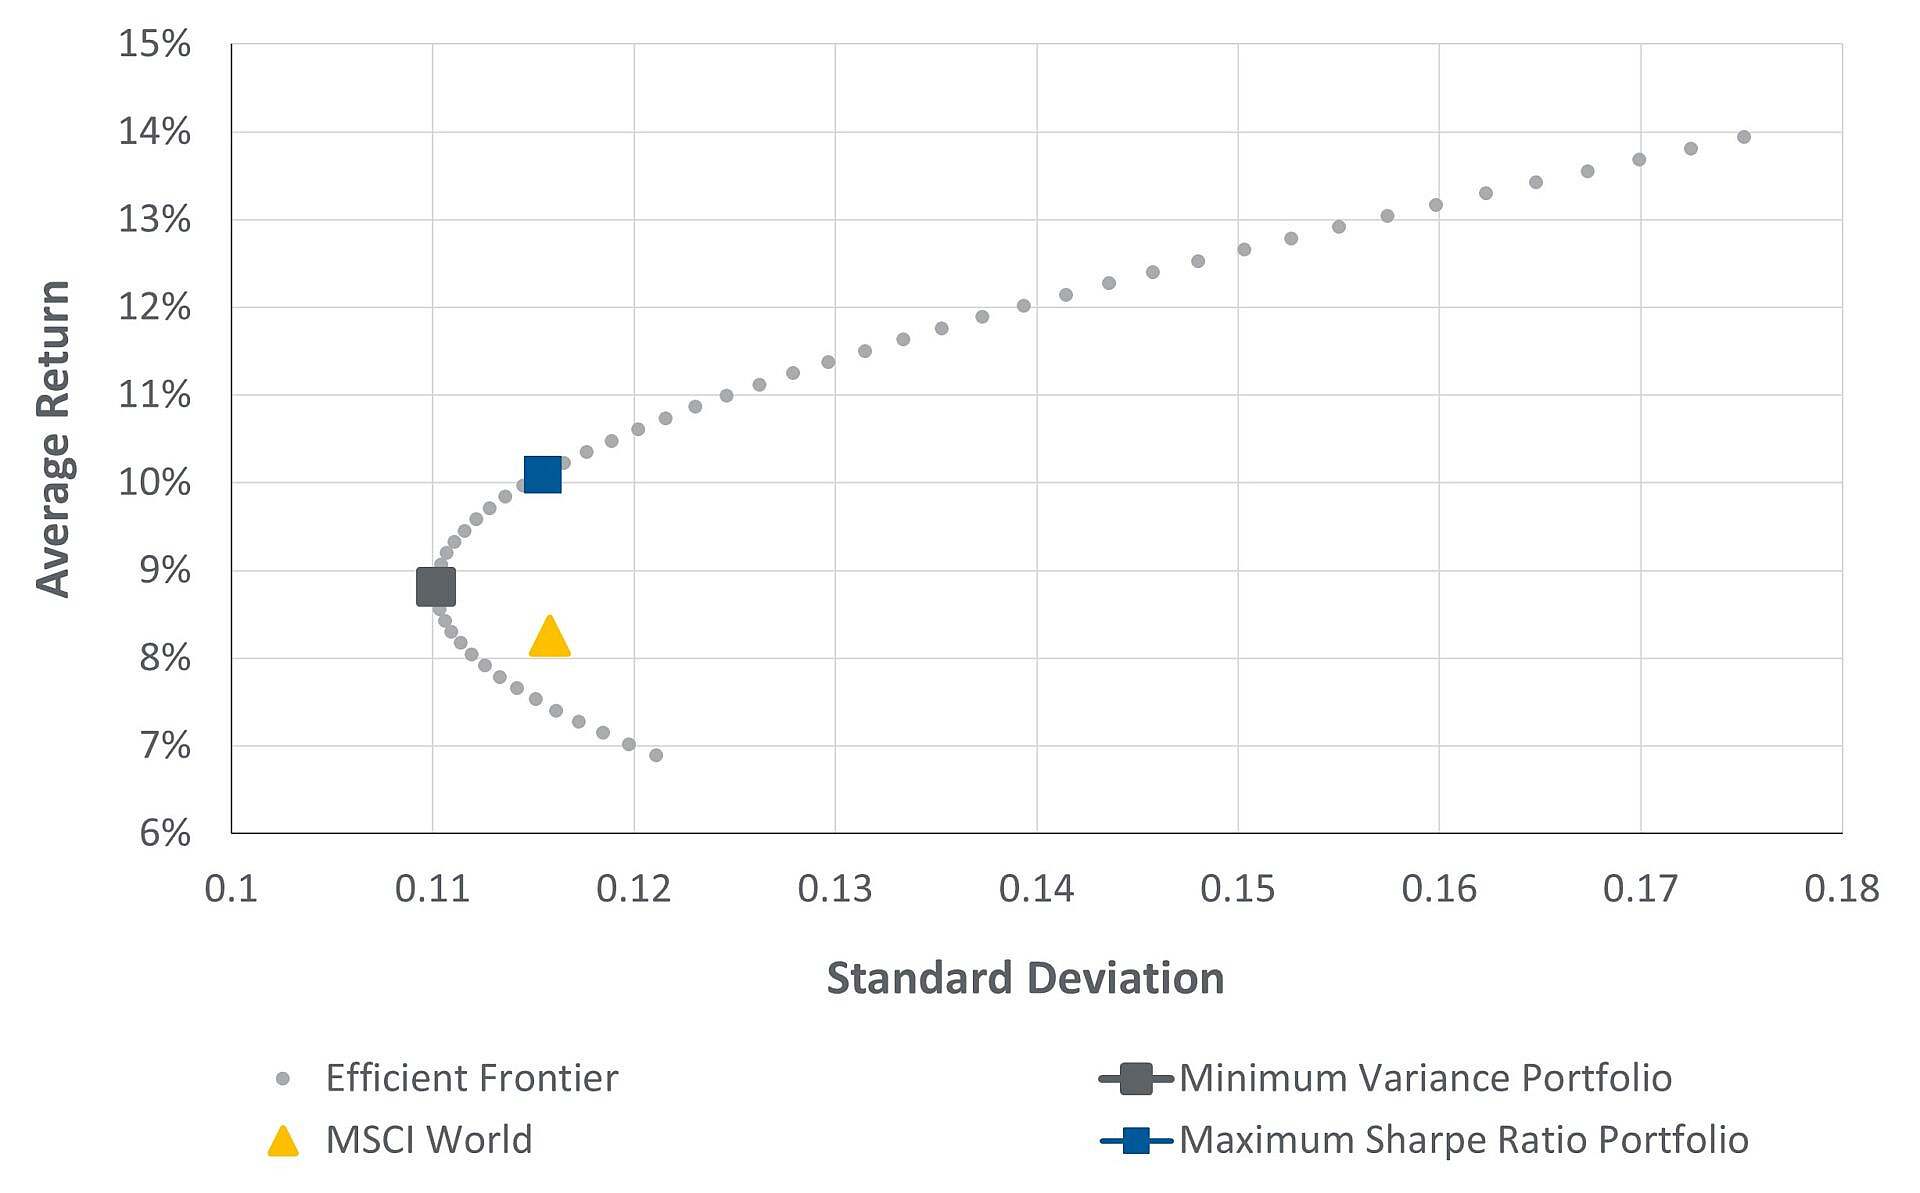
Another way to visualize the effect of how efficient portfolios can improve on the risk-return profile of the MSCI World is illustrated by the efficient frontier graph in Exhibit 6. This shows the set of optimal portfolios that offer the lowest level of risk for a given level of return. The resulting shape is typically a hyperbola, with a line curving upwards from left to right, which is the efficient frontier. An investment portfolio that finds itself on that line and towards the right can be considered optimal, with the highest possible return for a certain level of risk. The MSCI World Index (with only a ~3% allocation to Canadian equity) finds itself well below the line, indicating its inefficient risk-return characteristics, while the Minimum Variance Portfolio and Maximum Sharpe Ratio Portfolio, with Canadian equity allocations of 31% and 9%, respectively, fall on the efficient frontier.
Exhibit 6: The Efficient Frontier. This graph shows the risk-return profile of optimal portfolios based on an asset mix of Canadian, international and U.S. equities over the 20-year period to March 31, 2024. The graph also shows points indicating the risk-return profile of the MSCI World Index, the Minimum Variance Portfolio and the Maximum Sharpe Ratio Portfolio.
Sources: Bloomberg L.P. As at March 31, 2024.
Further to the efficient frontier analysis and based on our review of the last 20 years, a low allocation to Canadian stocks (such as in the MSCI World Index at ~3%) is likely not optimal for investors. The results of the analysis show that an allocation to Canadian equity of between 9% to 31%, depending on specific investor risk tolerance, has improved the efficiency of a world-focused portfolio.
In our view, Canadian equities have demonstrated solid risk-adjusted returns over the long term, including in the Beutel Goodman Canadian equity strategy, and continue to have positive long-term potential.
Beutel Goodman Canadian Equity Strategy
At Beutel Goodman, we are bottom-up value investors. We conduct fundamental research and look for stable companies with strong balance sheets that are trading at a discount to our estimate of intrinsic business value. We also set a target upside and downside price for each stock. We believe this approach can help provide a margin of safety and mitigate against the potential for capital loss in declining markets. Our approach also includes a process-driven sell discipline with a one-third sale (one-quarter for small cap companies) of securities that achieve our target price, and a secondary review by a different analyst for stocks that breach their downside targets.
Quality companies can be found across sectors on the S&P/TSX and tend to have either a strong international focus or a leading position in the domestic market.
While sector and security diversification are somewhat of an issue for the S&P/TSX, in our strategy we implement single-holding and sector weight limits to enhance diversification. Typically holding between 30 and 40 mid- to large-cap companies, the Canadian equity strategy is a concentrated portfolio with a high threshold for inclusion. The portfolio is not a proxy for the benchmark; rather, we conduct extensive fundamental research to select high-quality companies with attractive valuations with the potential for delivering strong risk-adjusted returns over the long term. Our sector diversification therefore stems from this bottom-up, benchmark-agnostic approach.
Our investment process is based on the belief that risk is absolute and the avoidance of capital loss is key to compound growth, and this has helped this strategy outperform the S&P/TSX in each of its negative-return years since 2000, as shown in Exhibit 7 below.
Exhibit 7: Canadian Equity Portfolio versus S&P/TSX Composite Index. This graph is for illustrative purposes to demonstrate the hypothetical growth of $10,000 invested in the Beutel Goodman Canadian equity strategy in June 1999 compared to the S&P/TSX over the same period. Beutel Goodman Canadian equity strategy is shown here through the blue line and the S&P/TSX is represented by the yellow line with the last two recessions encircled.
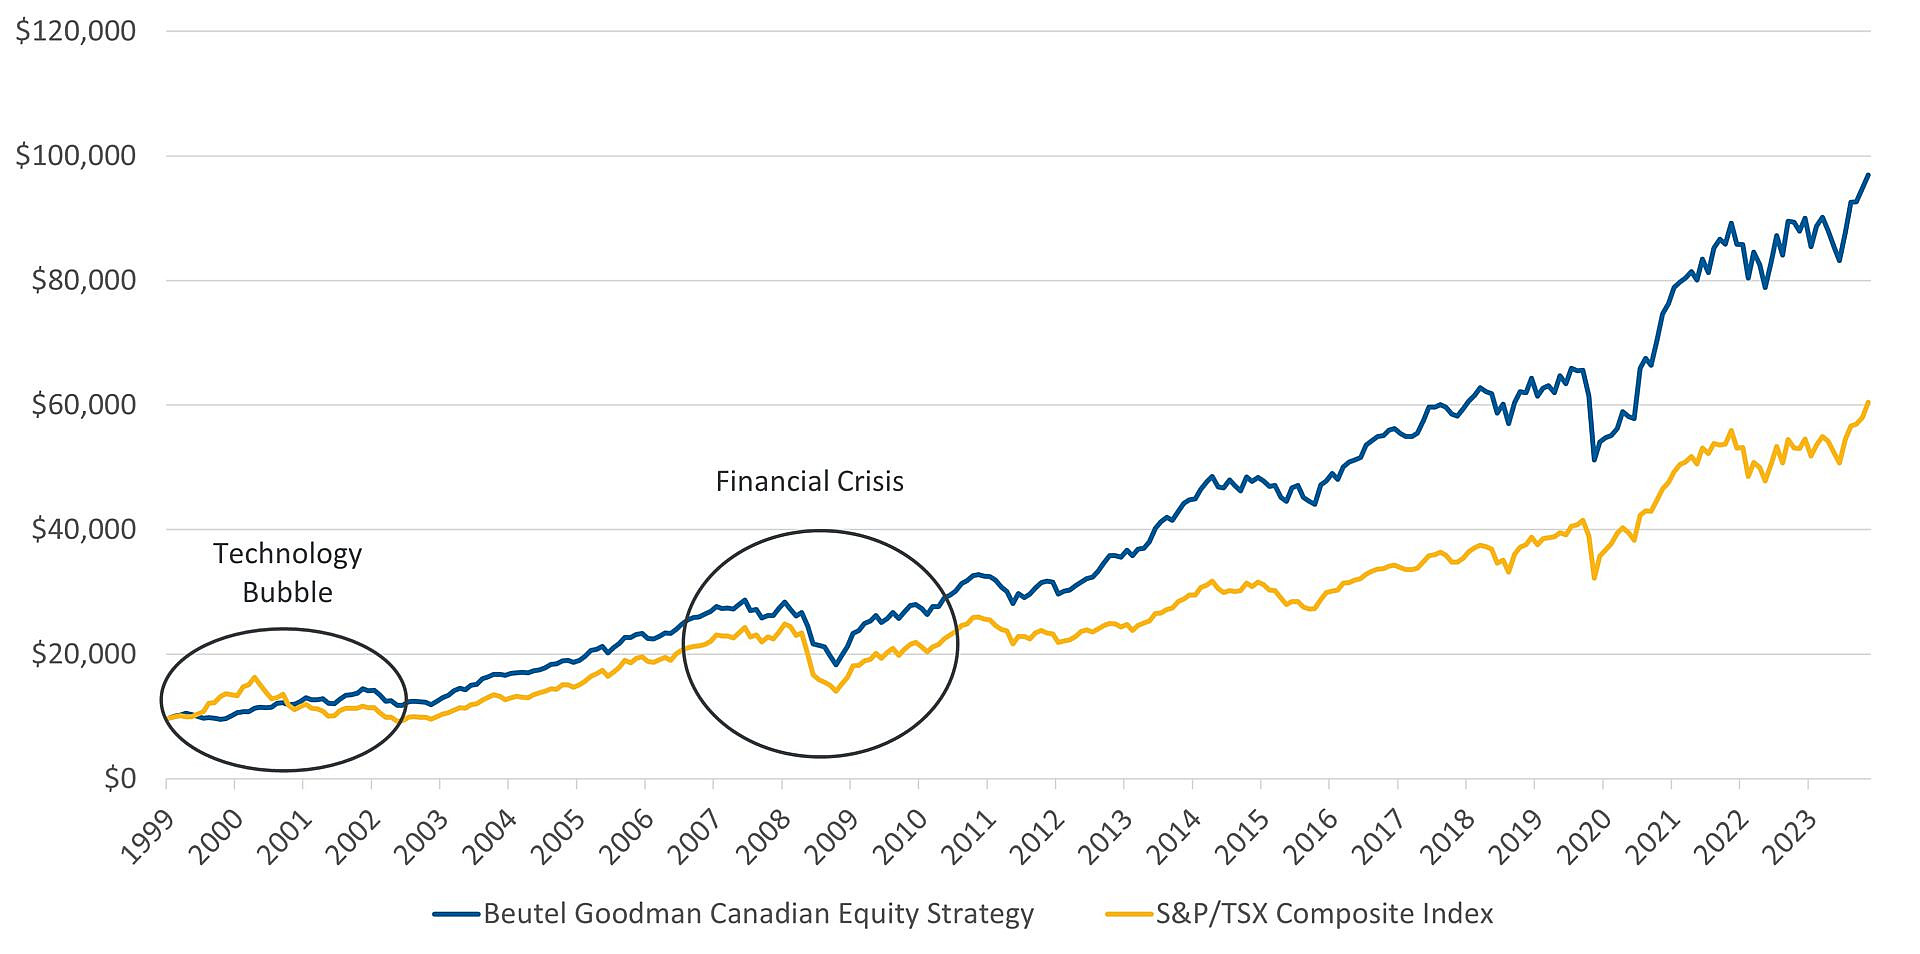
Source: eVestment. Returns are for the representative account of the Beutel Goodman Canadian equity strategy and are gross of fees and expenses. As at March 31, 2024.
The rate of return is used only to illustrate the effects of the compound growth rate and is not intended to reflect future values of the investment fund or returns on investment.
The Case for Canada
At Beutel Goodman, we conduct fundamental research to make informed investment decisions in accordance with our disciplined equity investment process. We focus on absolute risk and downside protection.
Value is at the forefront of our philosophy — overpaying for stocks limits potential returns.
After a challenging 2023, earnings expectations for 2024 and 2025 are also picking up for companies in the S&P/TSX, as shown in Exhibit 8.
Exhibit 8: S&P/TSX Bottom-Up Earnings. This table shows earnings expectations for the S&P/TSX Composite Index, as well as each of the 11 GICS sectors.
| Index | Consensus Earnings | %Growth | P/E Multiples | 2023 Revision | 2024 Revision | ||||||||
| Close | 2023 | 2024 | 2025 | 2023 | 2024 | 2025 | 2023 | 2024 | 1m | 3m | 1m | 3m | |
| Energy | 2960.78 | 216.89 | 221.07 | 253.17 | -31.00% | 1.90% | 14.50% | 13.7 | 13.4 | -1.00% | -0.90% | -2.50% | -7.70% |
| Materials | 3064.7 | 138.65 | 143.77 | 184.65 | -39.40% | 3.70% | 28.40% | 22.1 | 21.3 | -2.40% | -5.20% | -3.30% | -18.00% |
| Industrials | 5809.04 | 233.75 | 243.5 | 283.41 | 24.90% | 4.20% | 16.40% | 24.9 | 23.9 | 0.00% | 4.90% | 0.00% | -0.60% |
| Consumer Discretionary | 3036.91 | 178.41 | 195.04 | 229.22 | 4.20% | 9.30% | 17.50% | 17 | 15.6 | 0.20% | -1.30% | -0.40% | -5.80% |
| Consumer Staples | 8253.91 | 435.77 | 484.11 | 544.21 | 2.30% | 11.10% | 12.40% | 18.9 | 17 | -4.90% | -5.90% | -3.60% | -5.00% |
| Health | 112.19 | 13.81 | 17.53 | 18.33 | 19.70% | 27.00% | 4.50% | 8.1 | 6.4 | -0.70% | 4.60% | 0.00% | 10.70% |
| Financial | 3674.35 | 311.15 | 331.77 | 361.09 | 1.90% | 6.60% | 8.80% | 11.8 | 11.1 | -0.10% | -2.90% | 2.20% | 0.30% |
| Technology | 892.8 | 15.62 | 24.69 | 29.26 | 26.10% | 58.10% | 18.50% | 57.2 | 36.2 | -21.50% | -20.70% | -3.30% | -4.30% |
| Communications | 1297.13 | 86.7 | 88.34 | 95.98 | -1.40% | 1.90% | 8.60% | 15 | 14.7 | 0.00% | 1.20% | -0.30% | -3.90% |
| Utilities | 2358.93 | 123.3 | 131.37 | 144.37 | -0.80% | 6.50% | 9.90% | 19.1 | 18 | -0.20% | -12.60% | 3.50% | -5.80% |
| Real Estate | 3304.27 | 209.79 | 216.68 | 233.71 | -9.50% | 3.30% | 7.90% | 15.8 | 15.2 | 0.20% | -1.30% | -0.30% | -0.80% |
| TSX Composite | 22167.03 | 1369.1 | 1458.75 | 1648.09 | -10.50% | 6.50% | 13.00% | 16.2 | 15.2 | -1.30% | -2.70% | 0.00% | -4.00% |
Sources: Bloomberg Consensus Estimates, TSX Weights, TD Securities Inc. As at March 31, 2024.
The Canadian equity market tends to be more cyclical than some of its international peers, and there may be some economic headwinds facing Canada in the future. However, we believe the counter to this is using our disciplined investment process and fundamental research to invest in high-quality companies that historically have shown that they can overcome unfavourable market conditions and emerge on the other side stronger.
We believe in the long-term prospects for Canadian equities and that they should be an important component of investors’ diversified portfolios in the years to come.
Download PDF
Related Topics and Links of Interest:
- Finding Value Beyond the Index
- A Top-Down, Bottom-Up Dichotomy in Global Equity Investing
- Undefining Value Investing
©2024 Beutel, Goodman & Company Ltd. Do not sell or modify this document without the prior written consent of Beutel, Goodman & Company Ltd. This document represents the views of Beutel, Goodman & Company Ltd. as at the date indicated.
This document is not intended, and should not be relied upon, to provide legal, financial, accounting, tax, investment or other advice.
The index information contained in this document has been obtained from sources believed to be reliable, but we do not represent that it is accurate or complete and it should not be relied upon as such.
The reference to any trade names or trademarks of various third parties is solely for illustrative purposes. All product and company names are trademarks™ or registered® trademarks of their respective holders. Use of them does not imply any affiliation with, endorsement by, or association of any kind between them and Beutel Goodman.
The S&P 500 data (“Index”) is a product of S&P Dow Jones Indices LLC and has been licensed for use by Beutel, Goodman & Company Ltd. All rights reserved. S&P 500® is a registered trademark of Standard & Poor’s Financial Services LLC (“S&P”). Neither S&P Dow Jones Indices LLC or S&P, their affiliates nor their third party licensors make any representation or warranty, express or implied, as to the ability of any index to accurately represent the asset class or market sector that it purports to represent and none such entities shall have any liability for any errors, omissions, or interruptions of any index or any data related thereto.
Neither MSCI nor any other party involved in or related to compiling, computing or creating the MSCI data makes any express or implied warranties or representations with respect to such data (or the results to be obtained by the use thereof), and all such parties hereby expressly disclaim all warranties of originality, accuracy, completeness, merchantability or fitness for a particular purpose with respect to any such data. Without limiting any of the foregoing, in no event shall MSCI, any of its affiliates, or any third party involved in or related to compiling, computing or creating the data have any liability for any direct, indirect, special, punitive, consequential or any damages (including lost profits) even if notified of the possibility of such damages. No further distribution or dissemination of the MSCI data is permitted without MSCI’s express written consent.
Commissions, trailing commissions, management fees and expenses all may be associated with mutual fund investments. Please read the prospectus before investing. The indicated rates of return are the historical annual compounded total returns including changes in unit value and reinvestment of all distributions and do not take into account sales, redemptions, distributions or optional charges or income taxes payable by any securityholder that would have reduced returns. Mutual funds are not guaranteed, their values change frequently and past performance may not be repeated.
Certain portions of this document may contain forward-looking statements. Forward-looking statements include statements that are predictive in nature, that depend upon or refer to future events or conditions, or that include words such as “expects”, “anticipates”, “intends”, “plans”, “believes”, “estimates” and other similar forward-looking expressions. In addition, any statement that may be made concerning future performance, strategies or prospects, and possible future action, is also forward-looking statement. Forward-looking statements are based on current expectations and forecasts about future events and are inherently subject to, among other things, risks, uncertainties and assumptions which could cause actual events, results, performance or prospects to be incorrect or to differ materially from those expressed in, or implied by, these forward-looking statements.
These risks, uncertainties and assumptions include, but are not limited to, general economic, political and market factors, domestic and international, interest and foreign exchange rates, equity and capital markets, business competition, technological change, changes in government regulations, unexpected judicial or regulatory proceedings, and catastrophic events. This list of important factors is not exhaustive. Please consider these and other factors carefully before making any investment decisions and avoid placing undue reliance on forward-looking statements Beutel Goodman has no specific intention of updating any forward-looking statements whether as a result of new information, future events or otherwise.
