15 June 2021
Out of all the economic variables, none is more infamous and misunderstood than the inflation rate. The scars from the high inflationary period of the 1970s and early 1980s remain etched in the mind of the public and many market participants.
This infamy generally drives significant media coverage and alarmist headlines about the return of high 1970s style inflation whenever the Consumer Price Index (CPI) rises above a 2% annual rate. The April U.S. CPI rate of 4.2% has caused these headlines to return with a vengeance and the potential for “runaway inflation” has emerged as the primary narrative in financial markets, especially in fixed income. These alarmist predictions have been spectacularly wrong over the past 20 years, but this time it will be different due to the massive fiscal and monetary stimulus during the pandemic.
Or will it?
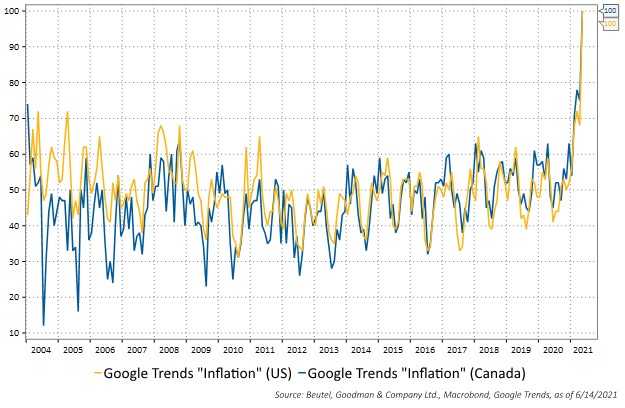
Figure 1: Google Search trends for the word Inflation. It is indexed to 100 at maximum, which also happens to be the last data point, May 31, 2021.
The total return for fixed income investors is based primarily on the movements of interest rates, and the primary driver of short- and long-term interest rates is the inflation rate. Therefore, it is crucial for fixed income investors to understand the drivers of inflation, the impact inflation has on the time value of money, and whether there has been a temporary or permanent shift in these drivers. The severity of the pandemic recession was unprecedented – but so was the amount of fiscal and monetary stimulus, the leap in automation and the speed of the recovery. Have the drivers of inflation permanently shifted higher?
All About the Base
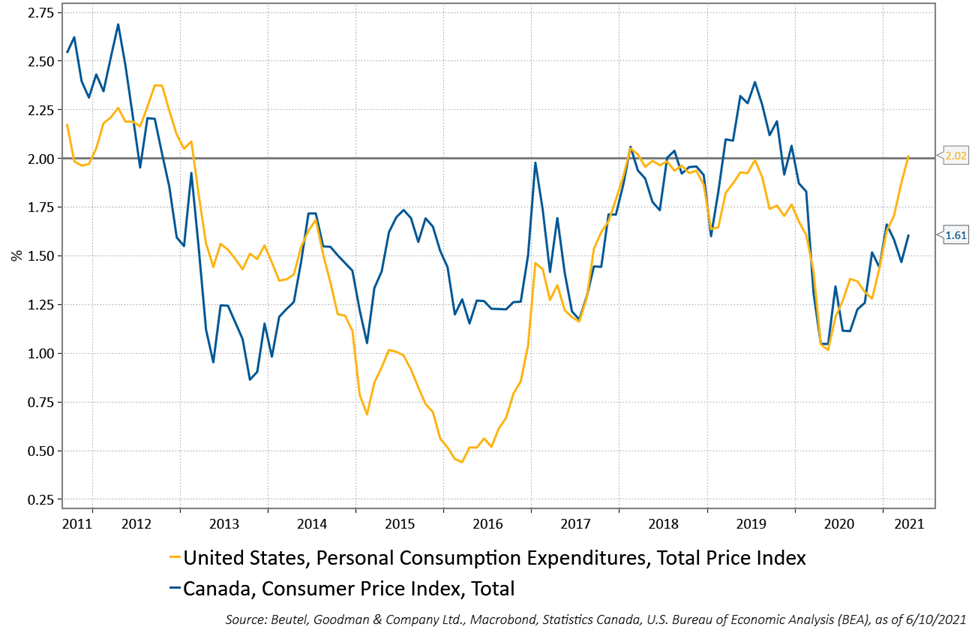
It is broadly understood that the recent spike in the annual inflation rate was driven mainly by “base effects”. A base effect is a purely an algebraic mechanism, where the denominator is low and inflates the number being calculated. Prices fell precipitously in March and April 2020 due to the pandemic lockdowns, with the price of an April oil futures contract even temporarily going negative. As the economy has reopened, prices have reverted to their long-term mean, which has caused a temporary spike in Q2 annual CPI reports due in large part to these “base effects”. Using a two-year rate of change, which smooths out the data and eliminates base effects from the pandemic, inflation indices have reverted to long-term averages and price pressures are currently not overly concerning (Figure 2).
Figure 2: The Two-Year Rate of Change of U.S. Personal Consumption Expenditures and Canada Consumer Price Index (Seasonally Adjusted, Annual Rates)
While the base effect has been the primary driver of the rise in inflation, a mismatch between supply and demand has also contributed. The COVID-19 pandemic was a unique recession that stopped certain sectors of the economy in their tracks in a way never seen before. This shock was extremely dislocating to manufacturing supply chains. With the economy reopening quickly in some places in 2021, demand is currently far exceeding supply, which has pushed prices higher in a variety of sectors (housing, energy, lumber, etc.). These price increases are likely to linger for a while but overall are expected to be transitory, as once supply bottlenecks ease, prices should move lower over time.
The Push and Pull
This type of supply-driven increase in prices is known as “cost-push inflation”. Cost-push inflation is mostly associated with an increase in the cost of production stemming from a decrease in supply. This type of inflation should be considered “bad inflation”, as in reality it acts like a tax on consumption and creates a substitution effect. An increase in gasoline prices would be an example of this as consumers are forced to absorb the higher price. The increased gasoline price reduces the ability of consumers to spend on other items and aggregate demand does not increase. This type of inflation also generally squeezes profit margins of producers as they are unable to fully pass through the entire increase in production costs. This, in turn, often leads to cost cutting elsewhere, such as reduced investment or layoffs. The only good part about this type of inflation is that it is generally self-correcting as higher prices lead to slower economic growth, which eventually causes prices to decline. In other words, price kills price.
The other type of inflation is “demand-pull inflation”, which comes from an increase in aggregate demand that pushes prices broadly higher. This should generally be considered “good inflation” because it is the increase in economic growth that is driving the price increases. This would typically drive an increase in sales, in turn prompting businesses to increase investment and expand hiring. As the labour market tightens, wages move higher and are often promptly redeployed into the economy through increased consumer spending. This type of increase in prices is often sustainable and leads to periods of strong economic growth, such as in the period from 2016 to 2018. It is not until central banks begin pushing back against this increased economic activity and rising prices by raising interest rates that we see a decline in aggregate demand and ultimately prices.
We believe that in addition to the base effects seen from ultra-low prices in 2020, most of the increase in prices during 2021 has been cost-push inflation and is likely unsustainable or transitory. It is a one-time or temporary increase in prices, not sustained inflation.
On the other hand, there have been some indications of the more sustainable demand-pull type of inflation, although they are minor at this point in the cycle. As they begin to increase, central banks will likely begin to acknowledge these indicators and hike interest rates appropriately. The market currently expects this to occur in Q4/2022 for the Bank of Canada and Q2/2023 for the U.S. Federal Reserve (Fed). The concern with this cycle is that central banks might not react to the rising inflation, as the Fed has embraced an “average inflation targeting” policy.
What is the Right Amount of Spice?
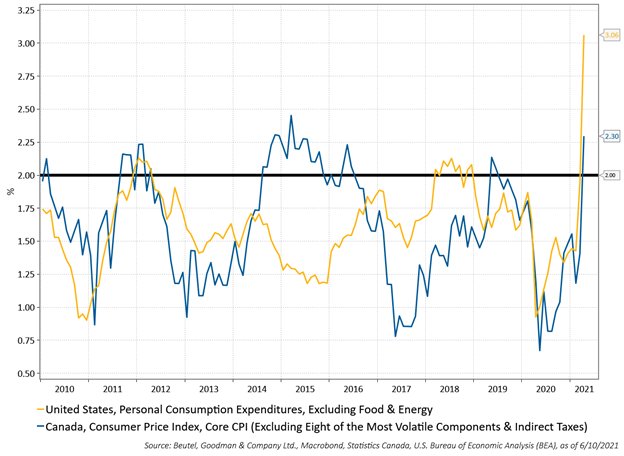
Inflation since the Global Financial Crisis has struggled to remain above 2%, driven by extreme scarring from the 2008 recession, huge technological advances, increasing globalization, and aging demographics (Figure 3). This period of chronically low inflation occurred over a decade while most developed economies’ central banks kept interest rates at their lower bound of essentially 0%. These central banks had little choice but to keep rates this low as they were fighting deflationary forces caused by structural factors and a massive drop in inflation expectations.
Figure 3: The U.S. and Canada’s measures of “Core” inflation since 2010. Both Core Inflation measures have, on average, been below the target 2% level for much of the period. Only in 2021 have both indices spiked. This illustrates the difficulty of achieving consistent 2.0% inflation.
If too-high inflation is bad and deflation is bad, then what is an acceptable increase in prices? This topic has been widely debated with no definitive answer. However, most agree that relatively low and stable inflation is best. The largest central banks, such as the Bank of Canada, the European Central Bank, and the Bank of England, have all set their target inflation rate at approximately 2%. While the Fed has a dual mandate of full employment and price stability, it also views this price stability level to be around 2%. The central banks view a 2% inflation rate as the “structural inflation rate” or “equilibrium inflation rate”, meaning it is a level that does not distort the real economy. The goal is essentially to keep the economy on an even keel.
During 2020, after years of below-target inflation, the Fed adopted a strategy it had been discussing for several years and modified its inflation mandate from “price stability” to an “average inflation target of 2%”. The Fed also modified its employment mandate to “maximum employment” from “full employment”. These two adjustments are an admission by the Fed that it will “run the economy hot” and accept higher inflation over the short term to reach “maximum employment”.
This shift in strategy has also been a large driver of the recent alarmist inflation stories. These stories, however, ignore the structural inflationary headwinds and misunderstand the Fed’s objective, which is to gradually increase wage inflation and thereby also decrease income inequality. Increasing wage inflation should drive inflation expectations back to levels seen prior to the global financial crisis, which in turn should lead to demand-pull or “good” inflation. The Fed and other global central banks have limited tools to fight deflation, as the effectiveness of monetary policy is dependent on the real rate of interest (nominal interest rate less the inflation rate). Therefore, the higher inflation is the lower real interest rates would be and thus more stimulative. Central banks are also cognizant of the large structural challenges in their efforts to maintain inflation at their target levels and are therefore willing to accept slightly higher inflation in the medium term to achieve their goals. Please refer to Table 1 in the Appendix for a look at the impact of various structural forces on expected inflation.
The Need for Speed
Another popular argument from “inflationistas” is that the massive increase in the money supply from fiscal and monetary stimulus leads to more money being in the economic system, which leads to more spending, pushing prices higher. However, as is generally the case, the devil is in the details. That is, the key to understanding inflation pressure is understanding where the money resides in the system.
The Quantity Theory of Money states that Money (M) x Velocity of Money (V) = Price (P) x Real GDP (Y) (MV=PY). What is happening right now is Money (M) is growing, but the velocity of money (V) is shrinking. Velocity of money (V) is defined as the average number of transactions on which a unit of money is spent. Over the pandemic, V has been falling, so a large part of the increase in the money supply is not transferring over to an increase in prices.
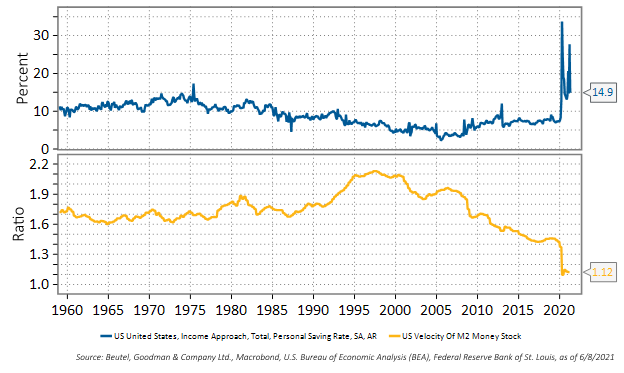
The fall in velocity is driven by where the money resides, which is mostly in bank reserves at the Fed and in personal bank accounts as the saving rate exploded higher in 2020. Furthermore, velocity is dependent on interest rates. The lower the interest rates are, the less money is “burning a hole in your pocket” and the less urgent one is to spend that money. If interest rates were high, then cash holdings would fall, as one would either invest it or spend it. The bottom line is that all the extra money is not circulating into the real economy, and thus it is unlikely to push inflation higher (see Figure 4).
Figure 4: The Personal Savings Rate has increased during the pandemic absorbing excess money supply and resulting in a drop in money velocity which is why inflation has remained relatively subdued thus far.
Conclusion
The COVID-19 pandemic caused a great distortion in supply and demand in the economy, which has caused prices to fluctuate drastically. We see this as a one-time phenomenon with no longer-term effects for now.
The massive amount of monetary stimulus and fiscal stimulus was needed to maintain economic stability in an economy that was completely shut down. This was transitory stimulus, and the effects will distort the numbers for months to come but should have only a minor impact on long-term inflation. It is likely that we are close to reaching an inflection point in inflation rates, as global central banks’ policy has shifted from fighting inflation (1980-2008), to fighting deflation (2009-2018), to promoting sustainable structural inflation. This will likely lead to marginally higher inflation in the coming years, of around 2.0% to 2.5%.
One point of caution is warranted, however. Supply-side economic reforms introduced in the 1980s pressured inflation lower. Policy was focused on the production/supply side of the economy to reduce the cost-push effect of inflation. These reforms included privatization, deregulation and labour reforms, and led to a significant reduction in unionization. The benefits of this policy were that the prices for manufactured goods fell significantly. The downside was that it neglected the consumer in favour of the corporation, causing a massive increase in wealth inequality, which is now a larger problem than inflation. After decades of slowly eroding the middle class, the world is now shifting from the supply-side policies to demand-side ones. The policies of U.S. Presidents FDR and LBJ are now becoming more in vogue. These policies are generally more inflationary in nature as they focus on increasing demand (labour and consumption) relative to supply (corporations and production). Time will tell how this plays out, but the stage has been set for this transition to continue.
Despite these trends, it is important to remember that the market economy is a deflationary machine. We are always learning and evolving and doing more with less. In the end, this will always pressure prices lower.
APPENDIX
Table 1: This table, which looks at the impact of various structural forces have had on inflation in previous cycles and the expected impact on the current cycle, is an example of the proprietary work Beutel Goodman’s Fixed Income team does to track inflation.
| Structural Force | Impact on Inflation Last cycle | Expected Impact current cycle | ||
| (H)eadwind | (H)eadwind | |||
| (T)ailwind | (T)ailwind | |||
| (U)ncertain | (U)ncertain | |||
| Trade conditions | Globalization | H | Fewer “low-hanging fruit” in globalization; populist politics favours de-globalization | U |
| Technological innovation: Moore’s Law | Persistent deflationary force esp. Goods | H | Expected to continue to be deflationary with shift into services | H |
| Energy prices | US oil shale supply boom | H | Peak oil demand and shift to higher cost renewables | U |
| Aggregate debt levels | Large increase in government and corporate debt | H | Canadian consumer over-levered but U.S. consumer has room to add debt. Governments and corporations are highly indebted | Canada: H |
| U.S.: H | ||||
| Wage growth: bargaining power of labour & Phillips curve returns to create wage-price spiral | Decreasing: decreased unionization, no wage/price spiral | H | Labor bargaining power is increasing slightly and wages should rise | T |
| Inflation expectations: must be prolonged and inflation expectations must become unanchored | Inflation expectations continued to fall post 2008 recession | H | Central banks attempting to move expectation back to pre-2008 levels | T |
| Demographics: lifecycle trends | Dependency ratios increased but large percentage of the population were in their high spending years (35-55 years old) | T | Dependency ratios continue to increase but millennials (the largest demographic group) enter their high spending years | U |
| Demographics: population growth | Declined about 0.5% in last cycle | H | Expected to stay at these depressed levels: 0.5% per year | H |
| Income and wealth inequality | Widening gap | H | Further widening expected, unless big policy/philosophical pivot | H |
| Prolonged fiscal stimulus/Deficit spending | Lack of coordinated global fiscal policy response | H | Unlikely to be a big shift after pandemic programs end | U |
| Imported inflation | Imported deflation | H | Expect to continue to import deflation especially from China as it becomes more “developed” and where working age population began to fall in 2020 | U |
Download PDF
Related Topics and Links of Interests
- 3 Key Questions on Fixed Income Answered: The Inflation “Problem”
- Beyond the Pandemic: Fireside Chat with David Gregoris and James Black
- Central Banks – The Cause and Solution to Bubbles?
©2021 Beutel, Goodman & Company Ltd. Do not sell or modify this document without the prior written consent of Beutel, Goodman & Company Ltd. This commentary represents the views of Beutel, Goodman & Company Ltd. as at the date indicated.
This document is not intended, and should not be relied upon, to provide legal, financial, accounting, tax, investment or other advice.
Certain portions of this report may contain forward-looking statements. Forward-looking statements include statements that are predictive in nature, that depend upon or refer to future events or conditions, or that include words such as “expects”, “anticipates”, “intends”, “plans”, “believes”, “estimates” and other similar forward-looking expressions. In addition, any statement that may be made concerning future performance, strategies or prospects, and possible future action, is also forward-looking statement. Forward-looking statements are based on current expectations and forecasts about future events and are inherently subject to, among other things, risks, uncertainties and assumptions which could cause actual events, results, performance or prospects to be incorrect or to differ materially from those expressed in, or implied by, these forward-looking statements.
These risks, uncertainties and assumptions include, but are not limited to, general economic, political and market factors, domestic and international, interest and foreign exchange rates, equity and capital markets, business competition, technological change, changes in government regulations, unexpected judicial or regulatory proceedings, and catastrophic events. This list of important factors is not exhaustive. Please consider these and other factors carefully before making any investment decisions and avoid placing undue reliance on forward-looking statements Beutel Goodman has no specific intention of updating any forward-looking statements whether as a result of new information, future events or otherwise.
