29 August 2022
By Beutel Goodman’s Fixed Income team
The summer months are typically much slower for bond issuance in the primary market, and this July was no exception. Only six corporate investment grade (IG) deals were issued in Canada during the month, for a total of $5.85 billion. Overall, one high yield (HY) and one securitized deal pushed July’s total deal count to six, with primary market volume of approximately $6.2 billion. This is significantly lower than the 10-year average July issuance volume of approximately $7.4 billion.
In the U.S., issuance from IG companies increased by 17% year over year to a total of US$93 billion. In contrast, HY issuance was practically non-existent, at a total of US$1.8 billion, which was down 94% year over year. Amidst the doldrums of the summer new issuance market, two anomalies stood out that are worth exploring in greater detail. Firstly, in Canada the massive issuance from the Canadian banks, and secondly, the dearth of issuance from HY-rated corporates in the United States.
Issuance Spigots Open for Canadian Banks
While the July primary market issuance was down from a historical perspective, Canada’s banks have told an entirely different story this year. Global issuance year-to-date (YTD) to the end of July for Canadian banks is approximately $185 billion, which is roughly 1.5x their historical annual issuance.
Domestically, financial issuance represented 86% of total July issuance, and 93% of July IG issuance. YTD, Financials have issued approximately $42 billion in the domestic market, representing approximately 60% of the total new-issue volume. To put this in perspective, the banks’ YTD domestic issuance is more than they issued in Canada in any of the past four full years. Issuance has been across all areas of the banks’ capital structures too, including Bail-in Deposit Notes, Limited Recourse Capital Notes, Non-Viability Contingent Capital (NVCC) and institutional preferred shares, while the preferred maturity for all parts of the banks’ capital structure has been the five-year part of the curve.
The banks’ heightened issuance in 2022 is contrary to every other sector, which has created a dislocation in the Canadian corporate bond market. In this environment, the banks’ five-year part of the curve has become artificially wide versus other defensive corporate sectors such as Utilities, as the market is struggling to digest the supply. Generally speaking, new issuance in markets where there is a degree of uncertainty and where central banks are tightening is credit negative. This uncertain backdrop causes corporate investors to demand a new issue concession, which is when a new issue comes with a wider credit spread compared to where a company’s existing credit spreads are trading. The investor then demands compensation for the perceived additional risk that they are assuming in more volatile markets. New issue concessions tend to lead to a repricing of risk, not only for the issuer, but often across all corporate sectors.
Canadian Bank Credit Spreads Remain Elevated
The most common debt that banks issue is five-year bail-in (senior unsecured debt), and this has widened by approximately 74 basis points (bps) YTD (source: BMO Sapphire Data). In comparison, the Bloomberg Canada Aggregate Corporate Index (option-adjusted spread) has experienced approximately 50 bps of widening YTD. In addition to underperforming the generic Canadian corporate index by approximately 25 bps, Canadian banks have also underperformed versus other defensive sectors such as Utilities and Telecommunications, as highlighted in the table (Exhibit 1). Bank bail-in spreads have widened 74 bps YTD while Utilities and Telecommunications spreads have only widened 54 bps and 36 bps YTD, respectively. The major reason to explain the difference in performance is the outsized issuance of bank debt over the period as each successive bank deal has generally come to the market with: (i) a wider credit spread and (ii) a concession versus the previous bail-in deal.
Exhibit 1: Five-Year Constant Maturity Credit Spreads
This table shows five-year credit spreads in Canada YTD and how increased issuance by Canadian banks has led to wider credit spreads compared to other defensive sectors such as Utilities and Telecommunications.
| Sector | Current Level (bps) | YTD Spread Change (bps) |
| Canadian bank bail-in | 163 | 74 |
| Canadian bank NVCC | 216 | 100 |
| Maple Financial* | 193 | 84 |
| Utilities | 100 | 54 |
| Telecommunications | 159 | 36 |
* (Foreign Financial Issuer in C$)
Source: BMO Sapphire, data as at 07/31/2022
All-In Yield Dislocation
The dislocation of bank spreads is reverberating across the rest of the Canadian market. The weight of Financials in the FTSE Canada Overall Bond Index is significant at 10% (34% of the FTSE Canada All Corporate Bond Index) and the big six Canadian banks make up 64% of the Financials sector’s overall weight. Any significant change in the credit spreads of such a large weight influences all other corporate sectors in the index, especially as bank bail-in notes are generally considered the benchmark for high-quality, liquid bonds, so other corporate sectors usually trade at a wider credit spread to the senior level of the banks’ capital structure.
In addition to the credit spread widening with the banks YTD, the yield curve in Canada has inverted, and this has led to the recent all-in yield dislocation. The graph below (Exhibit 2) shows constant maturity five-year bail-in bank debt’s all-in yield versus the all-in yield of a 30-year Utility — a sector that is also considered extremely stable, but where issuance skews to the long end. At current levels, an investor could buy five-year bank bail-in deposit notes at a higher yield than 30-year Utility debt. This may seem counterintuitive, as investors should be compensated for taking on duration risk, but this reinforces the distortion caused by the bank credit spread widening alongside the inversion.
Exhibit 2: All-In Yields: 5-Year Bail-Ins vs. 30-Year Utilities (in %)
This line graph shows a yield comparison between Canadian banks and Utilities. Currently, an investor could buy five-year bank bail-in deposit notes at a higher yield than 30-year Utility debt, despite the increased duration risk with the long-dated Utility.
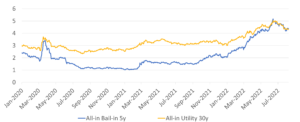
Source: BMO Sapphire Data, as of 8/5/2022
To combat stubbornly high inflation prints, central banks continue to raise overnight rates in an effort to curb demand across the wider economy. A slowing economy could be good for Canadian spreads initially, as reduced consumer demand should translate into lower bank credit growth. This should slow down bank issuance and allow spread relationships to normalize. Looking ahead, we continue to see value in front-end corporate debt and prefer Canadian banks over more cyclical issuers. We also expect the credit spread relationship between senior bank credit and other corporate sectors to normalize if bank issuance declines over the remainder of the year.
High Yield Issuance in the U.S.
While elevated bank issuance has characterized the Canadian fixed income market so far in 2022, in the U.S. fixed income market, it’s a lack of deals that stands out.
That’s particularly the case in the HY segment where new issue volume sits at US$82 billion through the first seven months of the year. This represents a decline of approximately 78% and 67% over the same period in 2021 and 2020, respectively. If this trend continues, primary HY market activity in the U.S. could end up below US$150 billion in 2022, which would represent the least amount of issuance in a calendar year since the Global Financial Crisis (2008) and compares unfavourably to the five-year pre-COVID average of approximately US$290 billion.
We believe there are several important factors influencing HY primary market activity YTD, but not all are necessarily negative for the asset class. Elevated market volatility and rising borrowing costs have been key contributors to the lack of issuance. This uncertain environment also means that most issuers are evaluating prospective new deals from a position of strength after exploiting the supportive backdrops in 2020 and 2021 when they opportunistically refinanced near-term callable debt to extend their maturity profiles. Between now and year-end 2024, only US$129 billion of HY debt is scheduled to mature, which is less than 10% of the overall market. The peak in maturities has now been pushed to 2029.
In our view, issuers are stronger now from a fundamental perspective, with net leverage and interest coverage ratios having recovered markedly over the past 18 months (see Exhibit 3.) With improved balance sheets, a number of the larger capital structures within HY that might otherwise have issued debt this year have risen to investment-grade status (known as “rising stars”) and printed new bond deals in the IG market instead, further exacerbating the lack of supply in the HY space.
Exhibit 3: Historical Net Leverage and Interest Coverage Ratio Movement
This line graph shows historical net leverage and interest coverage ratio movement for High Yield issuers in the United States.
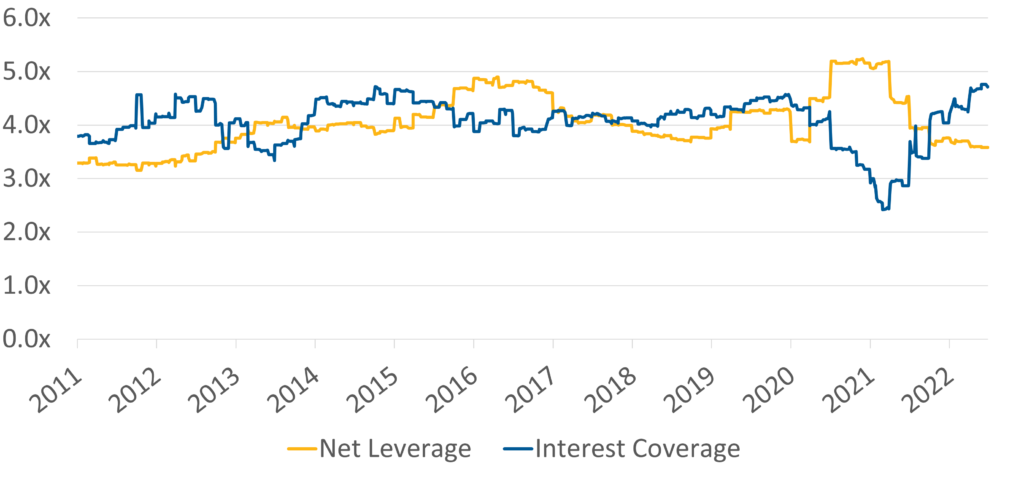
Source: BofA Global Research – “HY Credit Chartbook: July”. Data as of 7/31/2022
Moreover, cash balances remain elevated in many sectors, and for HY issuers in aggregate, offering further runway and support to those contemplating a new bond deal (See Exhibit 4).
Exhibit 4: Cash Balances per Sector vs. Long-Term Averages
This table shows cash balances per sector vs. long-term averages. The data confirm that cash balances are historically high in certain sectors, particularly Transportation and Utilities.
| Sector | Cash Balances (US$mm) | ||
| Q1 2022 | Long-Term Median | Variance | |
| Automotive | 287.0 | 470.1 | -183.1 |
| Basic Industry | 274.5 | 202.0 | 72.5 |
| Capital Goods | 218.4 | 168.8 | 49.6 |
| Consumer Goods | 192.8 | 106.0 | 86.8 |
| Energy | 66.9 | 68.3 | -1.4 |
| Health Care | 369.9 | 256.0 | 113.9 |
| Leisure | 584.3 | 226.1 | 358.2 |
| Media | 223.9 | 81.8 | 142.1 |
| Retail | 227.4 | 182.0 | 45.4 |
| Services | 351.8 | 198.8 | 153.0 |
| Technology & Electronics | 640.5 | 551.8 | 88.7 |
| Telecommunications | 327.9 | 328.6 | -0.7 |
| Transportation | 9,371.5 | 1,236.9 | 8,134.6 |
| Utility | 1,056.0 | 590.0 | 466.0 |
Source: CreditSights – “HY Liquidity Needs: 13 to Watch”, published 07/25.2022
We have identified only 13 issuers with meaningful maturities or cash needs through 2024, the majority of which are higher-quality/BB-rated. Absent a deep and prolonged recession, which is not our current base case, we expect that defaults will remain relatively low by historical standards in the coming years. The CCC rating cohort — typically the lowest quality issuers with the highest probability of default —represents just 10% of bonds slated to mature in 2023 and 2024 combined.
U.S. Issuers Remain Patient
Looking ahead to the remainder of the year for U.S. issuance, and accounting for the traditional August summer recess, volumes will likely remain muted through the Labour Day weekend, and pick up afterward. There is currently US$25.5 billion[1] of Merger & Acquisition (M&A) related issuance in the U.S. forward calendar, and we expect a number of those deals to launch in September if market conditions remain supportive. There could also be an uptick in funding needs if debt-financed M&A activity accelerates. However, with refinancing levels likely to remain uneconomic for the foreseeable future, we continue to expect opportunistic issuers who have access to other sources of financing such as bank lines or have cash on the balance sheet to stay on the sidelines until we have greater clarity on the macro-economic backdrop and the U.S. Federal Reserve’s hiking path.
[1] Morgan Stanley: Leveraged Finance Market Update (Week Ending August 5, 2022)
Download PDF
Related Topics and Links of Interest:
©2022 Beutel, Goodman & Company Ltd. Do not sell or modify this document without the prior written consent of Beutel, Goodman & Company Ltd. This commentary represents the views of Beutel, Goodman & Company Ltd. as at the date indicated.
This document is not intended, and should not be relied upon, to provide legal, financial, accounting, tax, investment or other advice.
Certain portions of this report may contain forward-looking statements. Forward-looking statements include statements that are predictive in nature, that depend upon or refer to future events or conditions, or that include words such as “expects”, “anticipates”, “intends”, “plans”, “believes”, “estimates” and other similar forward-looking expressions. In addition, any statement that may be made concerning future performance, strategies or prospects, and possible future action, is also forward-looking statement. Forward-looking statements are based on current expectations and forecasts about future events and are inherently subject to, among other things, risks, uncertainties and assumptions which could cause actual events, results, performance or prospects to be incorrect or to differ materially from those expressed in, or implied by, these forward-looking statements.
These risks, uncertainties and assumptions include, but are not limited to, general economic, political and market factors, domestic and international, interest and foreign exchange rates, equity and capital markets, business competition, technological change, changes in government regulations, unexpected judicial or regulatory proceedings, and catastrophic events. This list of important factors is not exhaustive. Please consider these and other factors carefully before making any investment decisions and avoid placing undue reliance on forward-looking statements Beutel Goodman has no specific intention of updating any forward-looking statements whether as a result of new information, future events or otherwise.
