12 May 2022
– By Beutel Goodman’s Fixed Income team
The yield curve has become a popular economic predictor in modern times, gaining an almost mythical reputation for its apparent ability to foresee impending gloom and doom. In more practical terms, the curve is just another piece of data for an investor to consider. In our view, it’s as useful as a GDP report or the latest corporate earnings in that it provides important information but does not paint a big, high-definition picture by itself.
The 2-year/10-year (2y10y) yield curve in the U.S. recently inverted. For many observers, especially in the media, the curve inversion is a sure sign that a recession is imminent. We are not so sure that it is, because the curve’s signals are not a guarantee. All recessions have historically been preceded by an inversion, but not all inversions lead to recession.
Defining the Yield Curve
At its foundation, the yield curve simply represents the price of money over time at different points in time. It is the bond market’s expectations of where interest rates are going in the future expressed through a spread or difference between short-term bond yields and long-term bond yields. Typically, the ones that matter most for measuring the shape of the curve are the relationship of 3-month to 10-year rates (3m10y) and the relationship of 2-year to 10-year rates.
When the curve is steep, it is discounting future interest rate hikes, or expecting an increase in long-term interest rates. When the curve is flat, the market either is unsure of the direction of rates or believes the status quo will be maintained. And when the curve is inverted, as it has recently in the U.S., it is looking through to the end of the tightening cycle, discounting future interest rate cuts or expecting a decline in long-term rates. That expected decline in long-term rates is typically associated with recessions, hence the apparently prophetic power of the curve itself.
What’s important to note is that in our view the curve itself is not a predictor. Rather, clues come from market participants distorting the curve through their expectations of what ought to occur. Changes in the shape of the curve offer us clues about interest rates. Today, the curve is telling us that the market expects interest rates in the U.S. to rise to about 3% before being cut back down to the 2.50%-2.75% level. Given that the Federal Funds Rate target range is currently 0.75-1%, even with the larger-magnitude increases of 50 basis points that the Federal Reserve is telegraphing, we believe that the odds of an imminent recession are quite low. What is clear from the curve, however, is that the bond market is already looking ahead to the next rate-cutting cycle.
Inversion Alone Isn’t Reason to Run
The yield curve has always inverted before a recession. That one fact is what gives the curve its reputation for supposed clairvoyance. The details behind an inversion are what provide any sort of actual predictive power, though, because they provide context about the signal. That context generally comes from two crucial pieces of information: the duration of an inversion and which parts of the yield curve have inverted.
The concept behind the duration of the inversion is straightforward: a short-lived inversion is a weaker signal while an extended inversion is a stronger signal. Using the 2y10y curve as an example, the pandemic recession of early 2020 was preceded by a week-long, shallow inversion in late 2019. That recession, effectively manufactured by policies that intentionally shutdown economies to try and slow the spread of the COVID-19 , was brief. The three previous recessions in 1990, 2001, and 2008 were preceded by multiple inversion events of varying depths (all deeper than the 2019 inversion signal), which lasted for months at a time.
Analyzing an inversion based on which parts of the curve have inverted is nuanced, more of a mixture of art and science. As previously mentioned, the 3m10y and the 2y10y curve are typically the two most important curves for investor expectations. The former has been more accurate in recession predictions, giving no false signals ahead of the past eight recessions versus one false signal for the latter[1]. Meanwhile, other parts of the curve can invert with seemingly little to no ability to foretell recessions.
When we look at the recent inversion with duration and location in mind, we conclude that it was a weak signal. The 2y10y curve inverted for less than one week as March turned into April. The 3m10y curve did not invert at all and has meaningfully steepened since the beginning of April. In our view, the 3m10y almost certainly will invert at some point ahead of the next recession, likely for more than just a few days, and that will provide us with a stronger signal of what may lie ahead.
The Clock is Ticking
Now that a yield curve inversion has happened, the countdown is on to the next economic recession. The flood of headlines and analysis have followed the event itself, adding to fearful sentiment around the inversion. We know the clock is ticking, but there is no way of knowing precisely how long it will run before the arrival of the next downturn.
History tells us that over the last five decades, an average of 20 months passes from the time the curve first inverts to when the next recession begins[2]. However, there is a wide variance as some recessions have come in less than one year while others have taken much longer to arrive. There is also variance in market performance after an inversion, for both equities and fixed income, although it has been broadly positive.
Chart 1 shows the 10y3m and 10y2y yield curve spreads over time, highlighting that they often invert for months at a time ahead of a recession (shown in shaded areas).
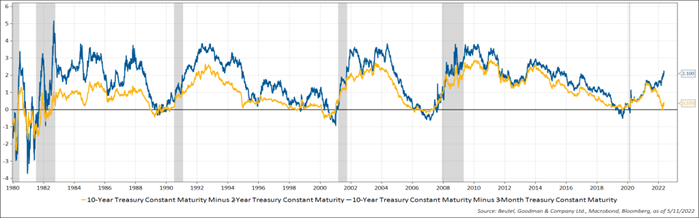
Table 1 shows the time between yield curve inversions and subsequent recessions in the past four decades, which can range from as little as six months up to three years.
| Start of Recession | First 10y3m Inversion | # of Months to Recession | First 10y2y Inversion | # of Months to Recession |
| January 1980 | N/A | N/A | August 1978 | 16 |
| July 1981 | N/A | N/A | September 1980 | 9 |
| July 1990 | March 1989 | 15 | Dec 1988 | 18 |
| March 2001 | September 1998 | 32 | May 1998 | 36 |
| December 2007 | January 2006 | 23 | December 2005 | 24 |
| March 2020 | March 2019 | 12 | August 2019 | 6 |
Source: Federal Reserve Economic Data
Solid Growth Doesn’t Guarantee a Soft Landing
One of the primary reasons we do not believe the recent curve inversion is a sign of imminent danger is the strength of economic data. GDP growth remains above of roughly 2%. Unemployment remains very low with a lot of upward movement within the labour market. While the economy is cooling, as expected as the lifting of COVID-related restrictions normalizes, it is still growing, even in the face of persistent inflation. However, it’s increasingly clear that the inflation problem needs to be addressed to prevent longer-term economic issues.
The recent curve inversion should not be overly surprising to anyone, given that central banks have once again returned to the role of inflation fighters. Central banks are hiking interest rates at speeds not seen in more than a decade. And while the central banks are aiming for a soft landing (that is to say GDP growth slows but remains positive while unemployment increases modestly), interest rate tightening cycles more often than not end in a recession or the bursting of an asset bubble, which then forces central banks to change course and begin lowering interest rates.
Central banks are in a tough spot. The demand side of inflation is very high, but the same cannot be said for the supply side of inflation. They can try to tame the demand side but cannot do much on the supply side of the equation – they cannot produce barrels of oil and bushels of wheat.
We believe central banks have a chance to manufacture the soft landing they are aiming for, but historically this has proven to be a noble yet elusive goal. The risk that their efforts lead to more economic pain than intended is very real. We do not currently think a recession is likely in 2022. For that to happen there would have to be a rapid deterioration in economic conditions. Higher interest rates may put the squeeze on many consumers (particularly homeowners who need to refinance their mortgages sooner rather than later), but it will also help quash inflation. A healthy job market should provide some balance on the consumer side, as well. But the picture beyond 2022 becomes much less clear.
Winter is Coming… It Always Does
Every interest rate cycle includes a yield curve inversion, and in many cases more than one. The change in the curve towards inversion tells us that the market expects interest rates to continue to rise before being cut in the medium term, which historically aligns with an economic recession. That is really all we know from the curve, even if media headlines make it seem like there’s a major correction lurking around the next corner.
Yield curve inversions are a bit like the leaves of a deciduous tree – they’re a sign of what’s to come. When the curve inverts briefly, it’s similar to the first few leaves falling in Autumn. Some of the leaves may not have even changed colour yet, just as many of the economic indicators have yet to show flashing warnings signs of a downturn. It is not until the inversion spreads to other parts of the curve and lasts longer than a handful of days that we can really start seeing through the forest to anticipate the next recession. We do know it is coming at some point and now have the opportunity to prepare, but we cannot say for sure when the first snowfall will come or when the economic data will tumble sharply.
The recent inversion, even if brief and shallow, does signal that it is a good time to upgrade the quality of our portfolios. These sorts of transitional periods are why we are active fixed income managers. Passively managed index bond funds, which often rebalance quarterly or sometimes even less frequently, tend to keep investors on the long end of the duration spectrum, minimizing potential gains on the short end while in our view adding unnecessary risk. Active managers have the ability to react much more quickly to changes in the curve and broader investment environment. While we are not running for the exits, as risk assets tend to continue to perform well for a period following an inversion, we are starting to make adjustments around the edges for what the inversion tells us will happen eventually.
Download PDF
Related Topics and Links of Interest:
- Energy Transition: An Opportunity and a Risk
- Keep Calm and “Carry” On – 2022 Credit Outlook
- (Don’t Fear) The Taper
[1] https://www.barrons.com/articles/inverted-yield-curve-recession-wall-street-51649170366
[2] https://www.statista.com/statistics/1087216/time-gap-between-yield-curve-inversion-and-recession/
©2022 Beutel, Goodman & Company Ltd. Do not sell or modify this document without the prior written consent of Beutel, Goodman & Company Ltd. This commentary represents the views of Beutel, Goodman & Company Ltd. as at the date indicated.
This document is not intended, and should not be relied upon, to provide legal, financial, accounting, tax, investment or other advice.
Certain portions of this report may contain forward-looking statements. Forward-looking statements include statements that are predictive in nature, that depend upon or refer to future events or conditions, or that include words such as “expects”, “anticipates”, “intends”, “plans”, “believes”, “estimates” and other similar forward-looking expressions. In addition, any statement that may be made concerning future performance, strategies or prospects, and possible future action, is also forward-looking statement. Forward-looking statements are based on current expectations and forecasts about future events and are inherently subject to, among other things, risks, uncertainties and assumptions which could cause actual events, results, performance or prospects to be incorrect or to differ materially from those expressed in, or implied by, these forward-looking statements.
These risks, uncertainties and assumptions include, but are not limited to, general economic, political and market factors, domestic and international, interest and foreign exchange rates, equity and capital markets, business competition, technological change, changes in government regulations, unexpected judicial or regulatory proceedings, and catastrophic events. This list of important factors is not exhaustive. Please consider these and other factors carefully before making any investment decisions and avoid placing undue reliance on forward-looking statements Beutel Goodman has no specific intention of updating any forward-looking statements whether as a result of new information, future events or otherwise.
