17 August 2021
By Beutel Goodman’s Fixed Income team
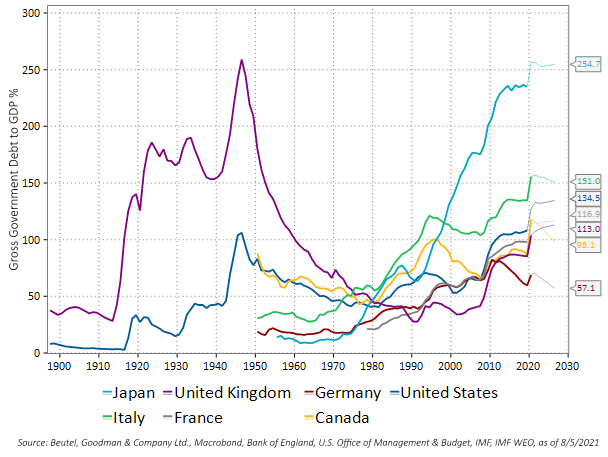
Apart from inflation, the number one question that we get asked from clients is what are we going to do about all that debt accumulated during the pandemic? We first visited this topic in our July 2020 monthly piece titled “Debt Supercycle Part II”. Now that the ink has for the most part dried on all the various stimulus plans, we can start to tally the impact. The accumulation of debt was well beyond the rise seen during the 2008 global financial crisis and was the largest since the major world wars in the 20th century (Figure 1).
Figure 1: G7 Gross Government Debt to GDP. This line graph shows the gross government debt to GDP ratios of G7 nations; i.e., Japan, Italy, U.K., France, Germany, U.S. and Canada. Data for the U.K. and U.S. date back from 1900, and for the others, from the 1950s to 1970s. Data is current to August 5, 2021, and includes estimated levels into 2026. The accumulation of debt is currently well beyond 2008 global financial crisis levels, and global debt is the largest since the 20th century’s major world wars.
According to the Institute of International Finance, global response to the COVID-19 pandemic has added US$24 trillion to the global debt mountain in 2020, bringing it to a new high of US$281 trillion. Global total debt/GDP has surged by 35% to over 355% of GDP in 2020 and Government Debt/GDP has increased to 105% of GDP in 2020, up from 88% in 2019[1]. Figure 2 provides a breakdown of Debt to GDP for selected countries. These elevated levels of debt place many countries in the “danger zone” identified by economic professors Kenneth Rogoff and Carmen Reinhart [2]. In the report, the authors argue that using data across all advanced countries, when Debt/GDP is greater than 90%, GDP growth is typically lower than countries with lower Debt/GDP ratios. In addition to sluggish growth, historically, huge debt buildups have also usually been followed by an uptick in inflation, and/or a financial crisis.
Figure 2: Debt/GDP (%) – Select Countries (2020). This bar graph shows the debt to GDP ratio for 2020 in the following regions, in descending order: Japan, Italy, advanced G20, the U.S., Spain, Canada, France, the U.K., Brazil, the world, the euro area, India, Germany, China and Australia. In 2020, Japan’s debt to GDP ratio was 254.6%, the U.S. ratio stood at 133.6% and Canada was 117.8%. This compares to the advanced G20 countries’ ratio of 133.9% and the world’s 98.7%.
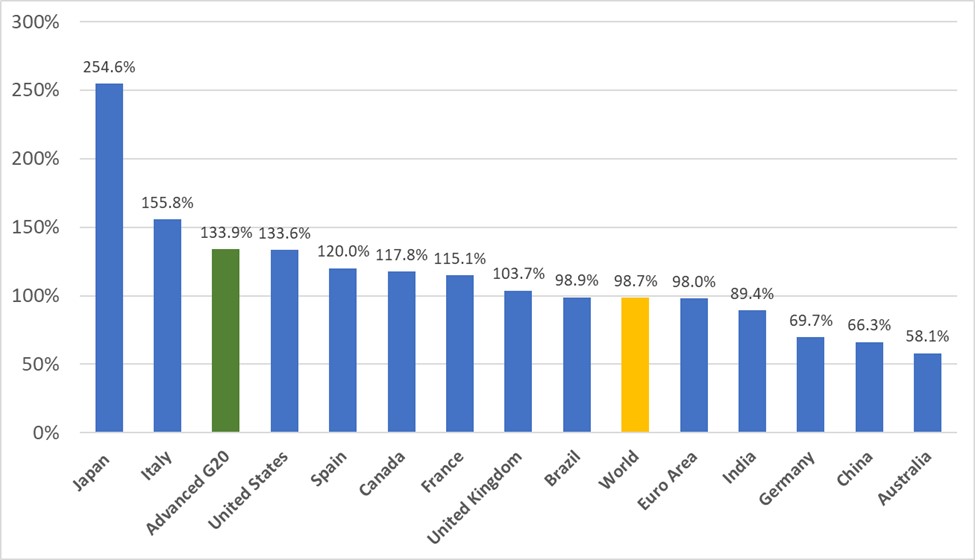
Source: IMF World Economic Outlook, July 2021 Update
The unprecedented fiscal and monetary policy stimulus was provided to bridge economies over the deep economic effects suffered after the imposition of pandemic lockdowns. These measures in part led to one of the shortest recessions on record. With vaccination rates rising and economies strengthening, focus now turns to how governments are going to address the elevated debt levels while some question whether anything really needs to be done. Traditionally, the ways to decrease bloated debt levels include:
- Austerity – including measures such as spending cuts and/or raising taxes. This path generally leads to prolonged slower growth and in some cases increases the chances of running into a period of stagflation. It also may be a difficult path to take due to demographics as an ageing population likely requires an increase in spending on health care. Global commitments to climate change initiatives will also likely require a significant increase in infrastructure spending.
- Growth – if economic growth exceeds the cost of government borrowing, the government can roll over its debt, and the Debt/GDP ratio will decline without the need to impose austerity measures.
- Inflation – reducing the real value of the debt through inflation. While central banks appear to have a tolerance for inflation to run over 2% in the near-term, in the long-term they are likely to aggressively push back against persistent higher inflation levels.
- Default – an extreme measure that has been used historically by emerging market countries but is not an option for developed nations.
Lower for Longer
Low interest rates make the debt burden manageable. This is a theory espoused by various scholars, policy advisors and economists[3], who argue that a cyclically balanced budget likely leads to inadequate growth and excessive financial instability. As a new guidepost, they propose that fiscal policy focus on supporting economic growth while preventing real debt service from being projected to rise quickly or to rise above 2% of GDP.[4] They believe that governments should stop paying attention to debt/GDP as a vulnerability altogether and instead focus on the size of interest payments. The focus on debt-servicing costs highlights the reliance of debt sustainability on the path of real rates relative to real growth (‘r-g’). As long as low servicing costs persist, the level of debt matters less. Some[5] have also argued that debt is sustainable when nominal interest rates are lower than nominal GDP growth as the cost of debt service is lower, if not negative.[6]
For this theory that low rates make debt manageable to be effective, interest rates would have to stay low for a long time. However, if increased spending sparks runaway inflation, the central banks could be forced to raise interest rates to tame inflation, and the model could collapse.
What About MMT?
No argument about debt sustainability is complete without a discussion of Modern Monetary Theory (MMT). MMT advocates believe governments that issue in their own currency can essentially borrow without limit. No matter how large the federal debt grows, the federal government can always print more money to pay for it. Breaking with conventional economic theories, MMT advocates argue that doing so imposes almost no serious costs or risks. MMT blurs the lines of central bank independence and government in essence sets both fiscal and monetary policy. The standard case against MMT is that it puts too much power in the hands of a government whose primary goal is to be re-elected, which will likely result in too much money being spent, sparking runaway inflation. Federal Reserve Chair Jerome Powell is not a MMT proponent as he stated in his Senate testimony in February 2019 that “the idea that deficits don’t matter for countries that can borrow in their own currency I think is just wrong.”[7]
No Such Thing as a Free Lunch
Those arguing that debt levels are unsustainable at their core believe what we were taught in economics class, that there is no such thing as a free lunch and that money borrowed has to be paid back. For advanced economies, the problem of carrying very high public debt may not be sustainability, but loss of flexibility in responding to unforeseen shocks. The reason that most countries have to watch their deficit and debt numbers is because, in the event of a shock, demand for their debt may fall sharply.[8] A loss of investor confidence in a safe haven like the U.S. could lead to a sell-off of U.S. Treasury debt, which could push up interest rates and inflation and crowd out private investment. A working paper undertaken by the IMF studied 188 financial crises since the 1980s and concluded that public debt in its various forms is the most important predictor of fiscal crises.[9]
Keeping interest rates low to manage debt payments can lead to financial instability by fueling asset and credit bubbles. Some warning signs already starting to percolate are seen in price to earnings ratios, housing prices, crypto currency, high yield corporate debt, meme stocks and special purpose acquisition companies (SPACs). Leaving rates at the lower bound is also a form of financial repression. Negative real interest rates may reduce or liquidate existing debts but also become the equivalent of a tax—a transfer from creditors (savers) to borrowers.[10]
Where the Rubber Meets the Road
For bond markets, with elevated debt levels and deficits, there is concern that governments do not have enough capacity to spend during the next recession. The economy is already well into its expansion phase so will there be enough time for governments to address their deficits before the next economic downturn occurs?
This is likely the sticking point for credit rating agencies and there are some emerging signs of credit rating concern. The U.S. remains AAA rated by DBRS, Moody’s and Fitch, but Fitch assigned a Negative outlook in July 2021 citing risks to public finances and debt trajectory. We note that S&P has maintained the U.S. credit rating at AA+ since the debt ceiling crisis of 2011.
Canada lost one of its prized AAA ratings when Fitch downgraded the sovereign by one notch in June 2020, but Canada remains AAA rated by S&P, Moody’s and DBRS. The Fitch downgrade was a result of the deterioration of Canada’s public finances resulting from the pandemic. The rating agency is concerned that Canada emerges from the crisis with much higher debt levels. CD Howe produced a recent study on Canada’s debt and concluded that under their baseline scenario the federal debt burden is on an upward long-run drift with the debt ratio reaching 60% by 2055. Nationally, taking provincial governments into consideration, the combined federal/provincial net debt ratio could reach over 140% under the baseline scenario, and almost 100% even under the more favourable budget scenario (the budget scenario is based on projections in the federal budget and assumes strong economic growth, a modest increase in interest rates and no further changes to spending programs or tax cuts). The only other time Canada’s debt burden was over 100% was in the aftermath of World War II.[11]
On the provincial side, deficits have soared and Debt/GDP ratios have also increased significantly (Table 1). The pandemic has forced the provinces off the fiscal consolidation path and has significantly pushed back the timing for balanced budgets, leaving them vulnerable to the next downturn. Alberta was downgraded by one notch by three rating agencies over the past year. British Columbia lost one of its AAA ratings. Saskatchewan was downgraded by one notch by two rating agencies also losing one of its AAA Ratings. Also of note, DBRS has placed Newfoundland and Labrador’s A (Low) rating on Negative outlook. It is very rare for a Canadian province to be rated in the BBB space. In fact, it has only occurred twice. S&P rated Saskatchewan in the BBB space from June 1992 to May 1996 and Newfoundland and Labrador was rated BBB+ by S&P from July 1994 to August 1999.
Table 1: Provincial Deficits and Debt/GDP
| FY 2020-2021 | ||
| Budget Balance ($M) | Debt/GDP | |
| British Columbia | (8,144) | 20.3% |
| Alberta | (20,192) | 20.3% |
| Saskatchewan | (1,865) | 19.0% |
| Manitoba | (2,080) | 38.8% |
| Ontario | (38,500) | 47.1% |
| Quebec | (15,000) | 45.0% |
| New Brunswick | (13) | 37.3% |
| Nova Scotia | (705) | 37.4% |
| PEI | (120) | 34.5% |
| Newfoundland and Labrador | (1,644) | 51.8% |
Source: RBC Economics, Provincial Budgets
The Bottom Line
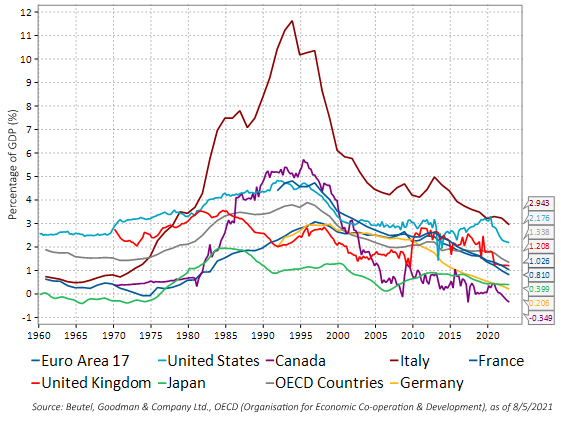
For now, bond markets are shrugging off debt concerns as interest payments remain low (Figure 3), the central bank tightening cycle is perceived as a long way off, and inflation, while elevated, is transitory. In the long run, the bloated government balance sheets will likely have to be dealt with. Governments and central banks will need to manage interest rate and inflation expectations so that debt does not become an unsustainable problem.
Figure 3: Net General Government Interest Payments, As a Percentage of GDP. This line graph shows the net general government interest payments of the euro area 17, the U.S., Canada, Italy, France, the U.K., Japan, OECD countries and Germany, as a percentage of GDP, since 1960. Currently, interest payments remain low, ranging from -0.349% of GDP in Canada to 2.943% in Italy.
[1]“COVID Drives Debt Surge—Stabilization Ahead?”, Global Debt Monitor, Institute of International Finance, February 17, 2021.
[2]Rogoff, Kenneth and Reinhart, Carmen, “Growth in a Time of Debt”, Working Paper 15639, National Bureau of Economic Research, January 2010.
[3] This list includes former Democratic policy advisors Jason Furman and Larry Summers, as well as the former chief economist of the International Monetary Fund, Olivier Blanchard
[4] Furman, Jason and Summers, Lawrence, “A Reconsideration of Fiscal Policy in the Era of Low Interest Rates”, Harvard Kennedy School, November 30, 2020.
[5] Namely, Olivier Blanchard.
[6] Blanchard, Olivier, “Public Debt and Low Interest Rates.” American Economic Review, 2019.
[7] McCormick, Liz, “Jerome Powell Says the Concept of MMT Is ‘Just Wrong’”, Bloomberg News, February 26, 2019.
[8] Rogoff, Kenneth, “Is Higher Debt an (Almost) Free Lunch?” Harvard University, February 26, 2021.
[9] Badia, Marialuz Moreno, Medas, Paulo, Gupta, Pranav, and Xiang, Yuan, “Debt is not Free” International Monetary Fund Working Paper No.20/1, January 2020.
[10] Reinhart, Carmen M., Kirkegaard, Jacob F., and Sbrancia, M. Belen, “Financial Repression Redux”, International Monetary Fund Working Paper Vol.48 No.1, June 2011.
[11]Laurin, Alexandre and Drummond, Don, “Rolling the Dice on Canada’s Fiscal Future” C.D. Howe Institute, July 29, 2021
Download PDF
Related Topics and Links of Interests
- Hello Inflation, my old friend – I’ve come to talk about you again
- Ask Us Anything (About Bonds)
- Central Banks – The Cause and Solution to Bubbles?
©2021 Beutel, Goodman & Company Ltd. Do not sell or modify this document without the prior written consent of Beutel, Goodman & Company Ltd. This commentary represents the views of Beutel, Goodman & Company Ltd. as at the date indicated.
This document is not intended, and should not be relied upon, to provide legal, financial, accounting, tax, investment or other advice.
Certain portions of this report may contain forward-looking statements. Forward-looking statements include statements that are predictive in nature, that depend upon or refer to future events or conditions, or that include words such as “expects”, “anticipates”, “intends”, “plans”, “believes”, “estimates” and other similar forward-looking expressions. In addition, any statement that may be made concerning future performance, strategies or prospects, and possible future action, is also forward-looking statement. Forward-looking statements are based on current expectations and forecasts about future events and are inherently subject to, among other things, risks, uncertainties and assumptions which could cause actual events, results, performance or prospects to be incorrect or to differ materially from those expressed in, or implied by, these forward-looking statements.
These risks, uncertainties and assumptions include, but are not limited to, general economic, political and market factors, domestic and international, interest and foreign exchange rates, equity and capital markets, business competition, technological change, changes in government regulations, unexpected judicial or regulatory proceedings, and catastrophic events. This list of important factors is not exhaustive. Please consider these and other factors carefully before making any investment decisions and avoid placing undue reliance on forward-looking statements Beutel Goodman has no specific intention of updating any forward-looking statements whether as a result of new information, future events or otherwise.
